How-to-use FCS Express
Cyrus Martinian 
David Rach
Installation
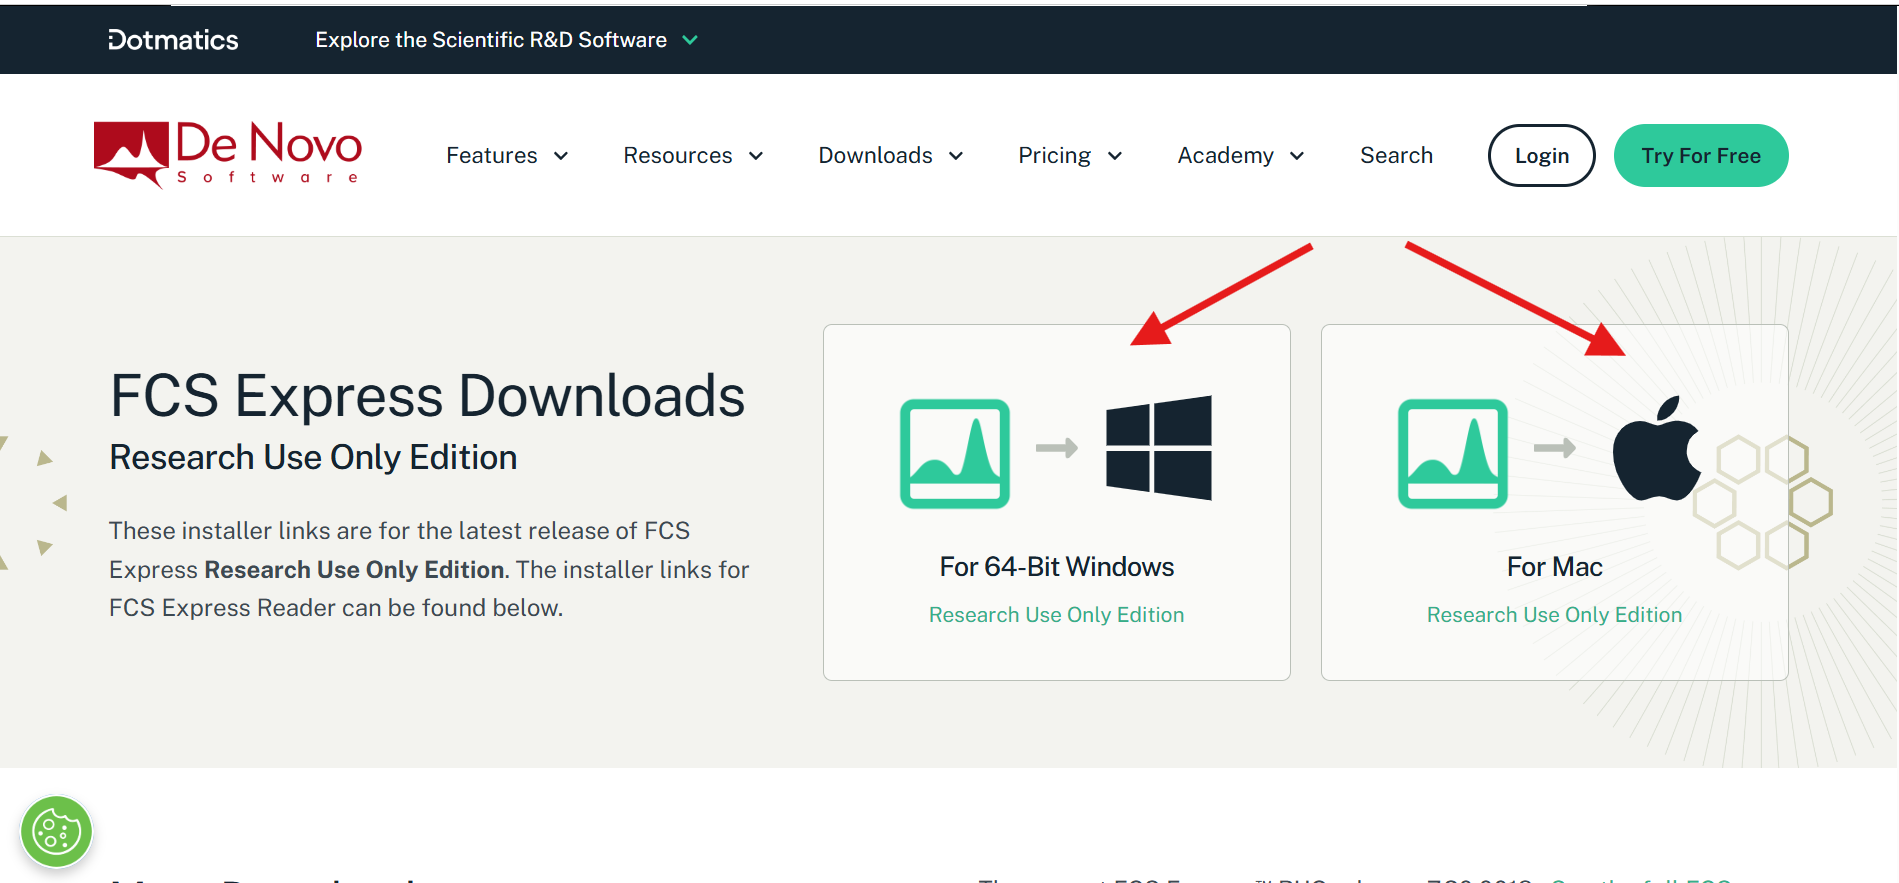
First, navigate to the FCSExpress website, and select the download option for your operating system (Windows or MacOS)
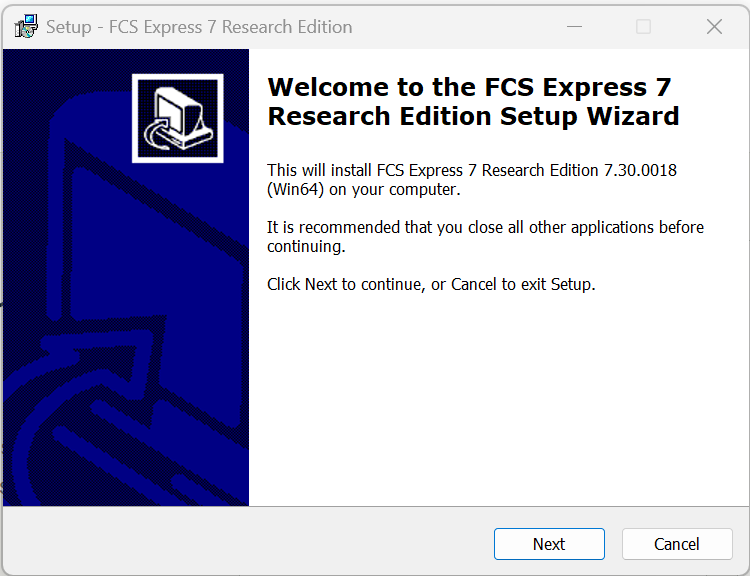
Once you select the download option, and initiate the installation on your device, you will see the following pop up.
You must accept the license agreement, and privacy policy of FCS Express.
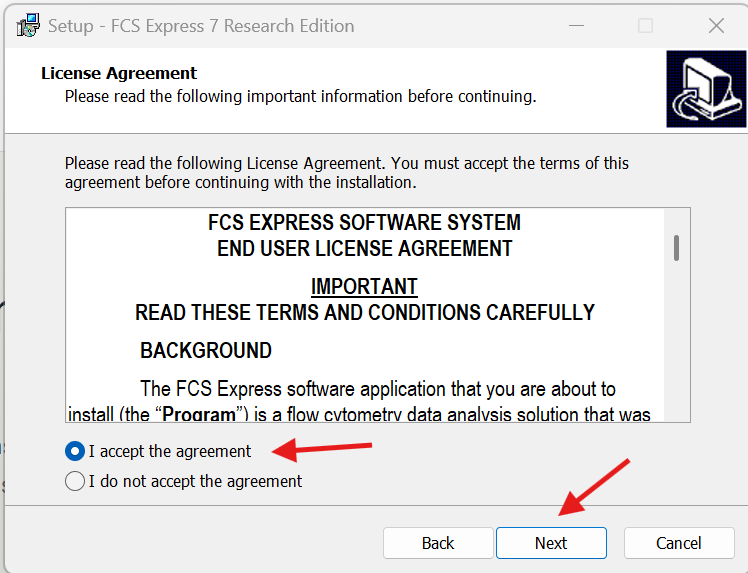
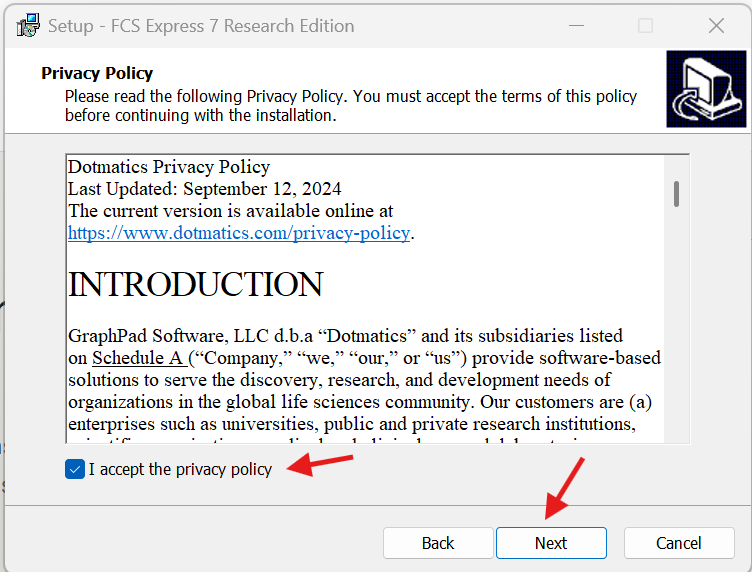
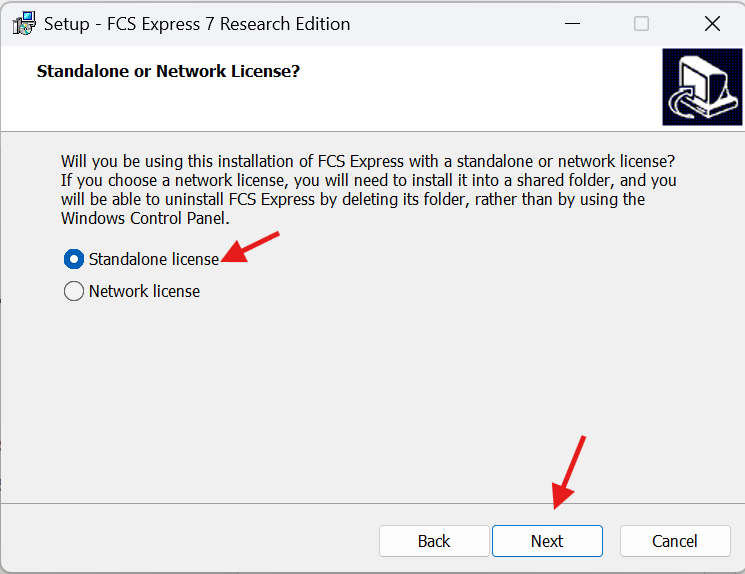
You will then be asked if you will be using FCS Express with a Standalone or Network License. Select Standalone, and hit next.
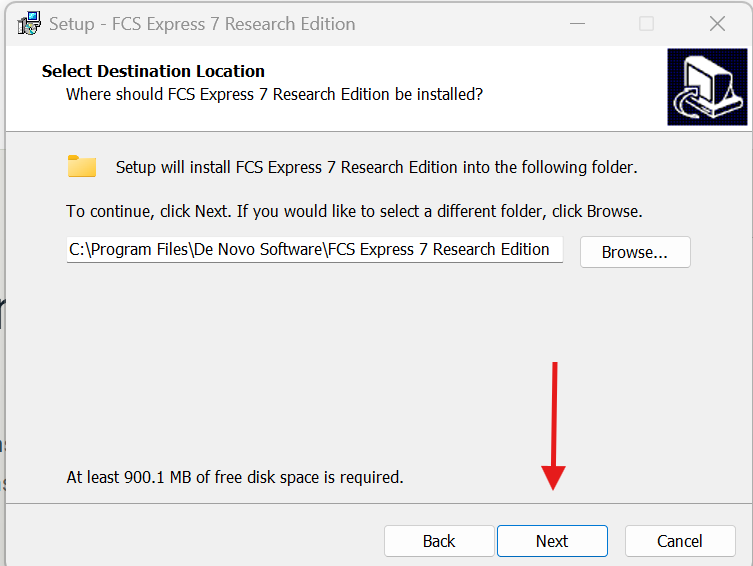
Select a location for FCS Express to be installed, and hit next.
Select install to install FCS Express.
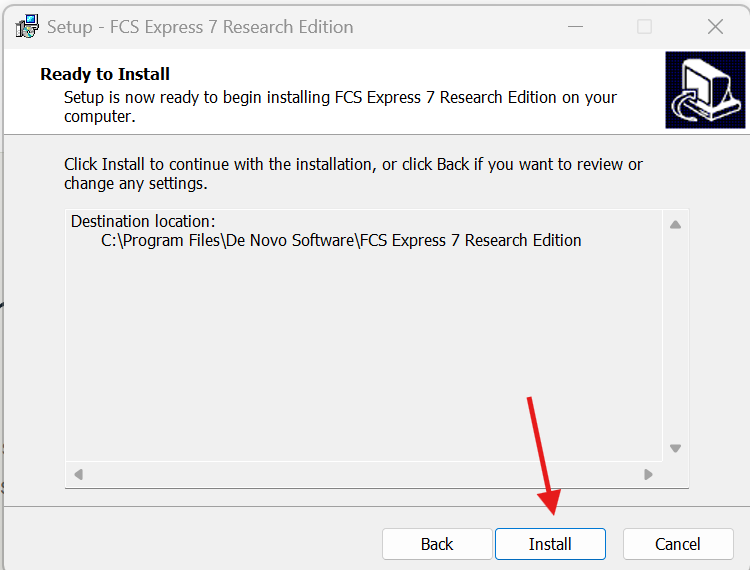
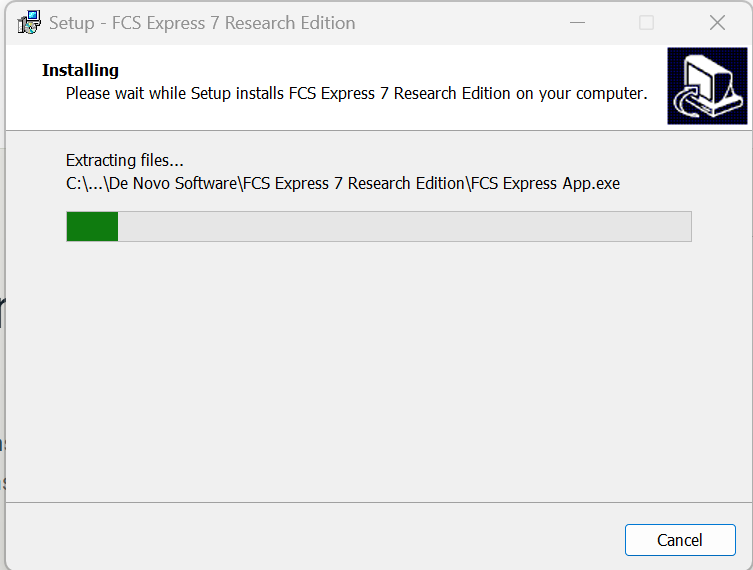
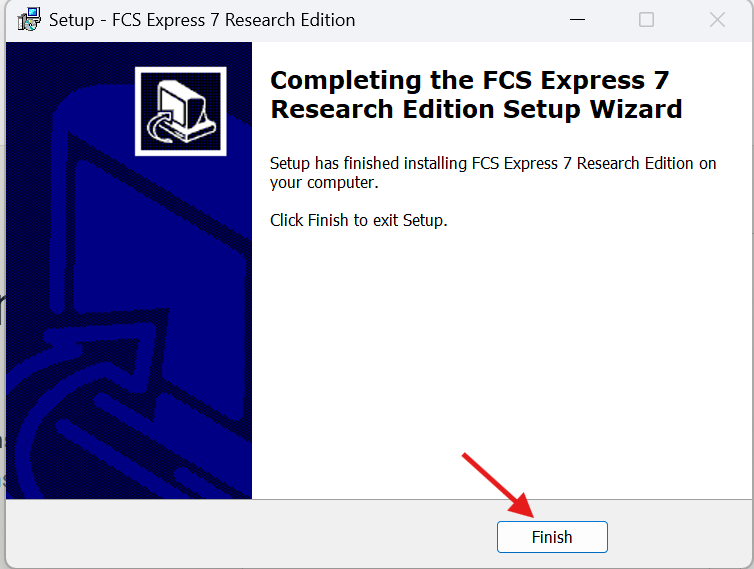
With FCSExpress now installed, proceed to open the software.
Getting Started
Now that FCS Express has been installed, upon opening the application you will see the following screen.
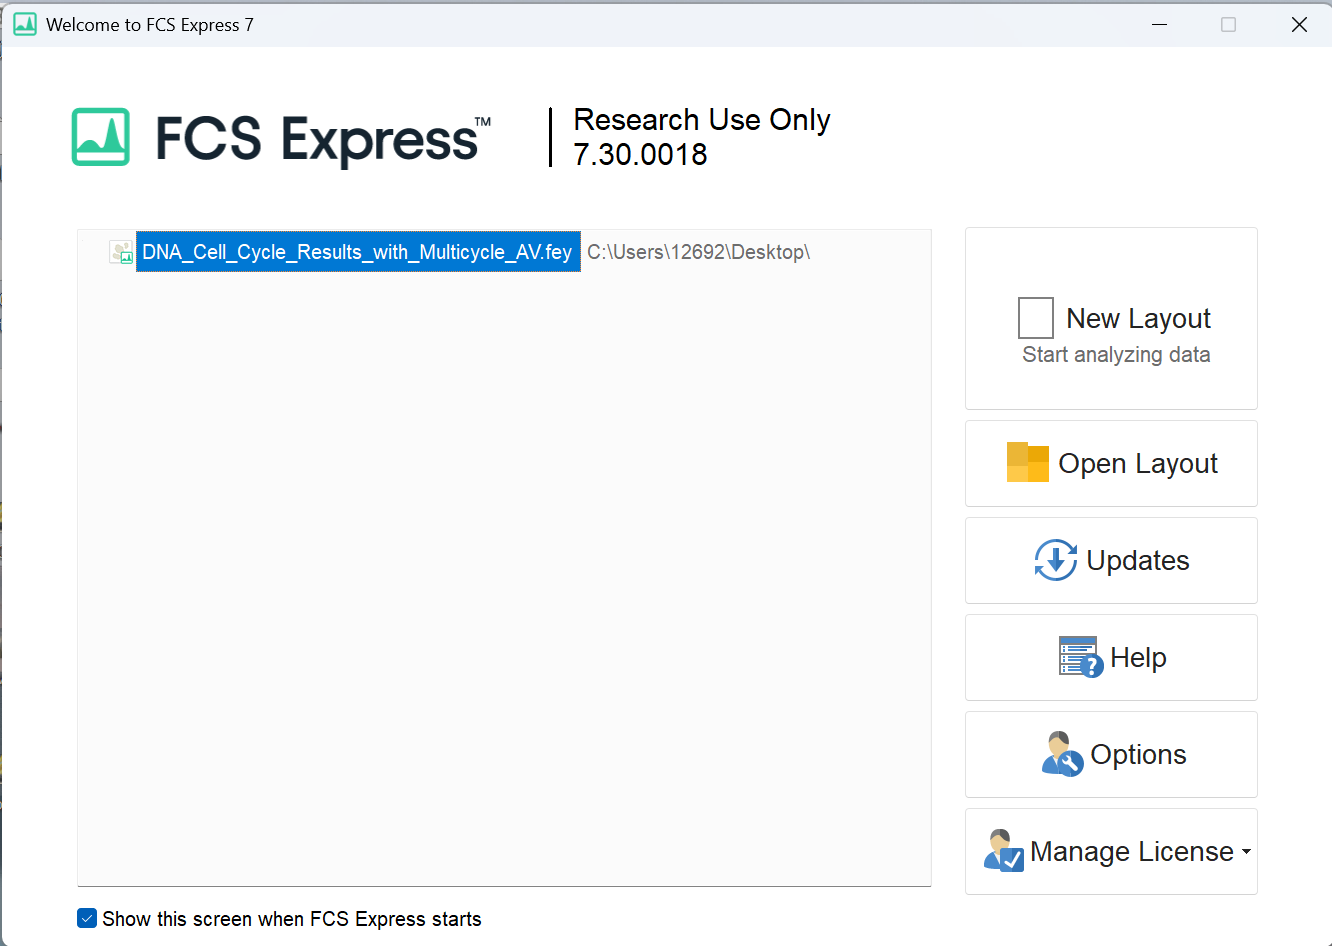
To check for updates to the software, select the updates button. Ensure that your installation is up to date.
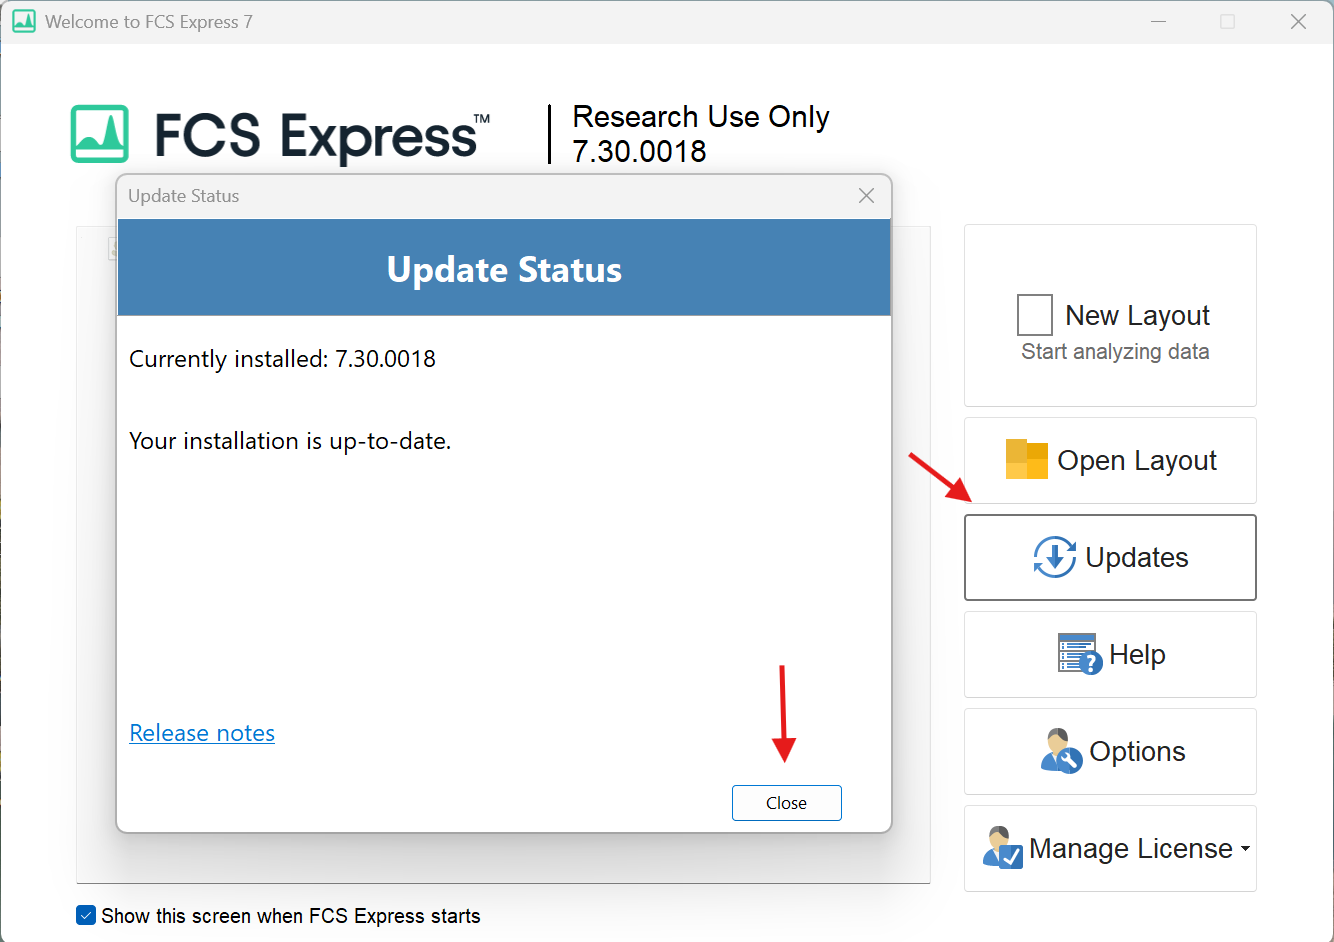
Next, select the New Layout option.
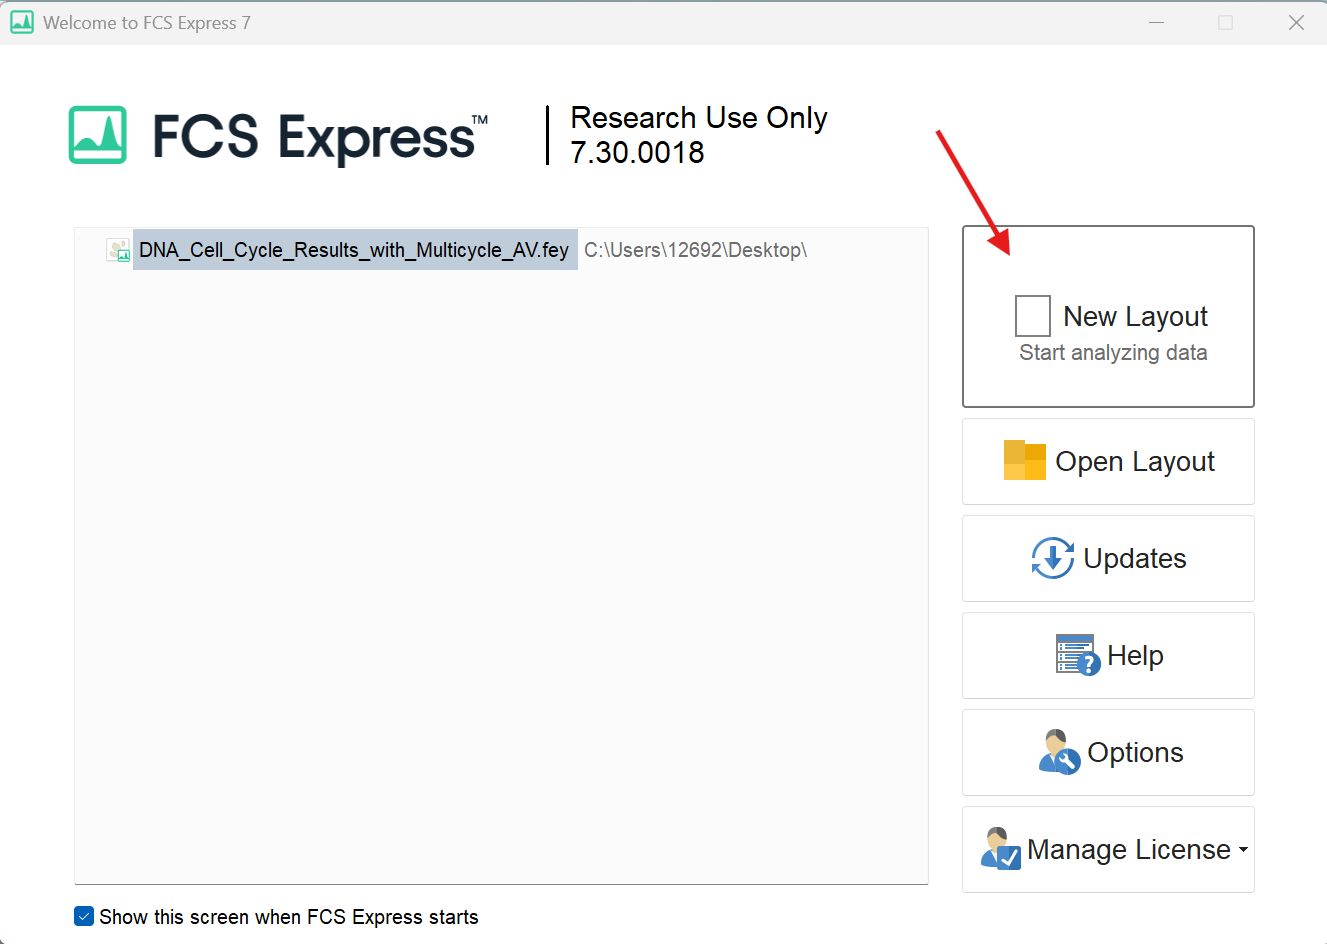
After selecting New Layout, the program will open to the following screen.
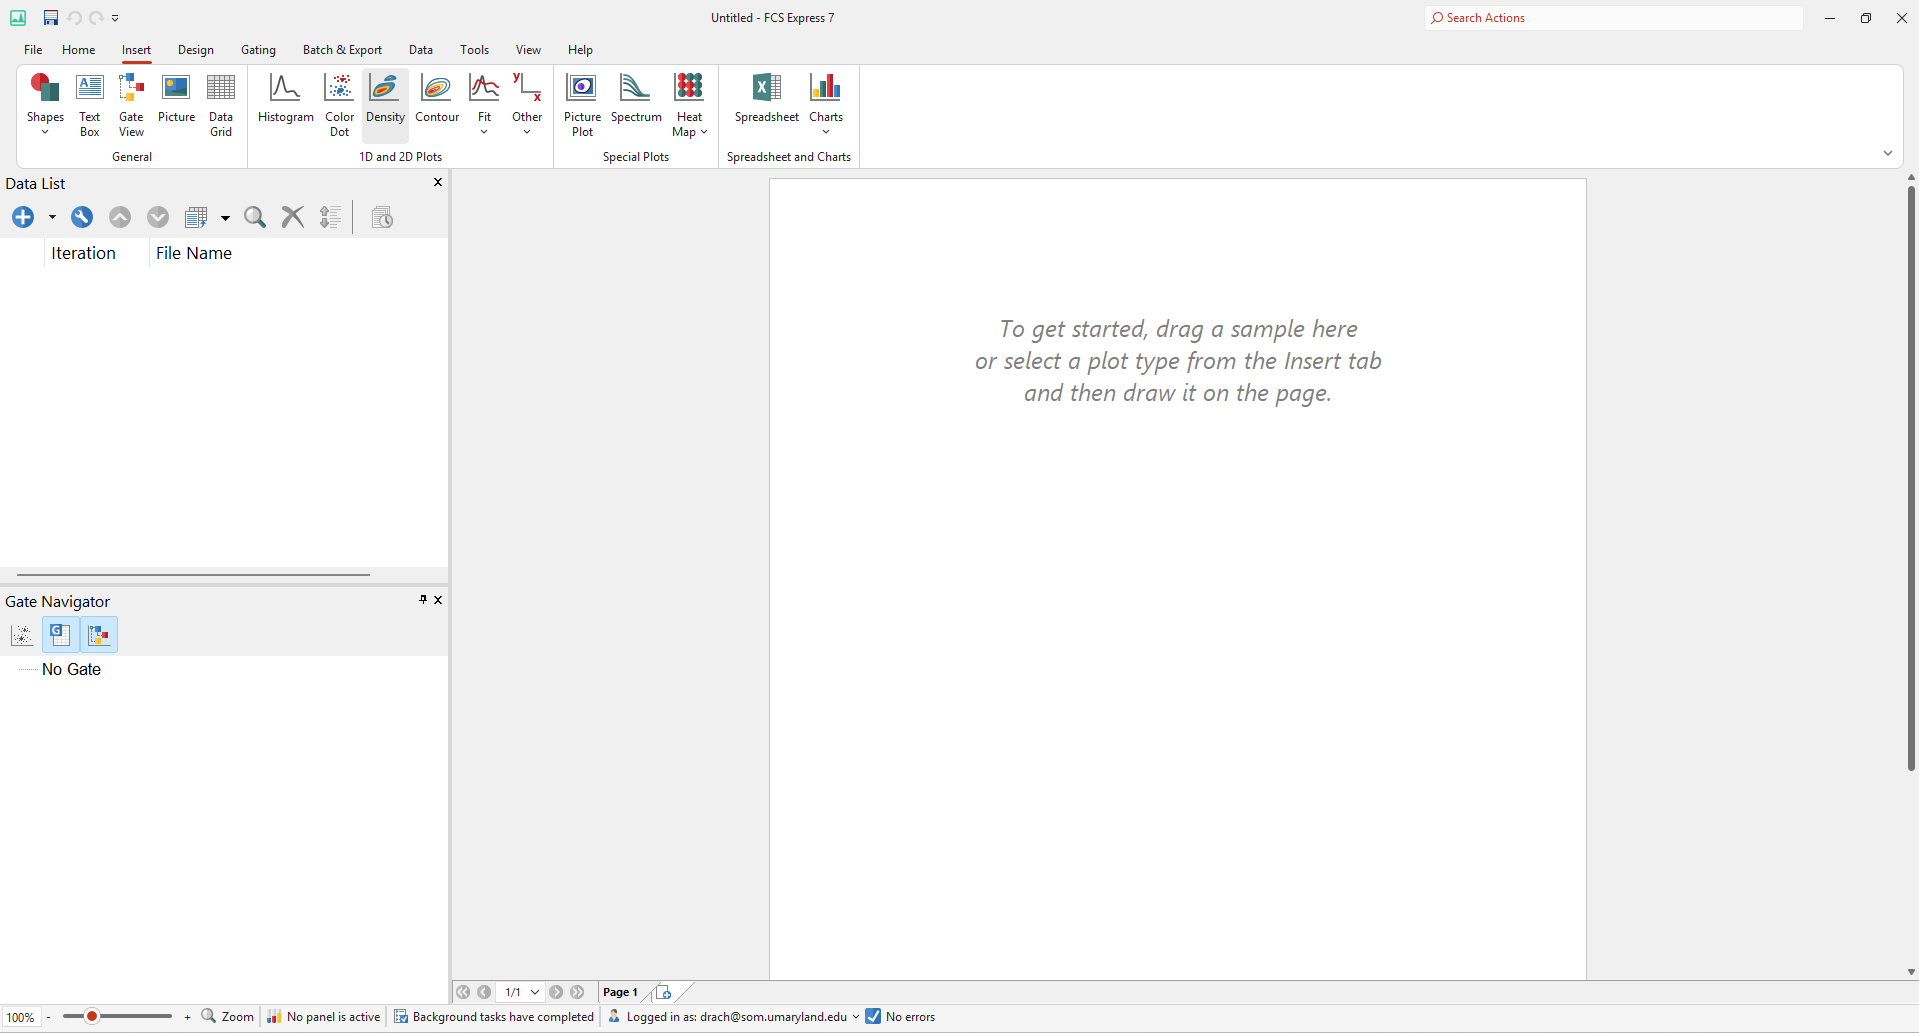
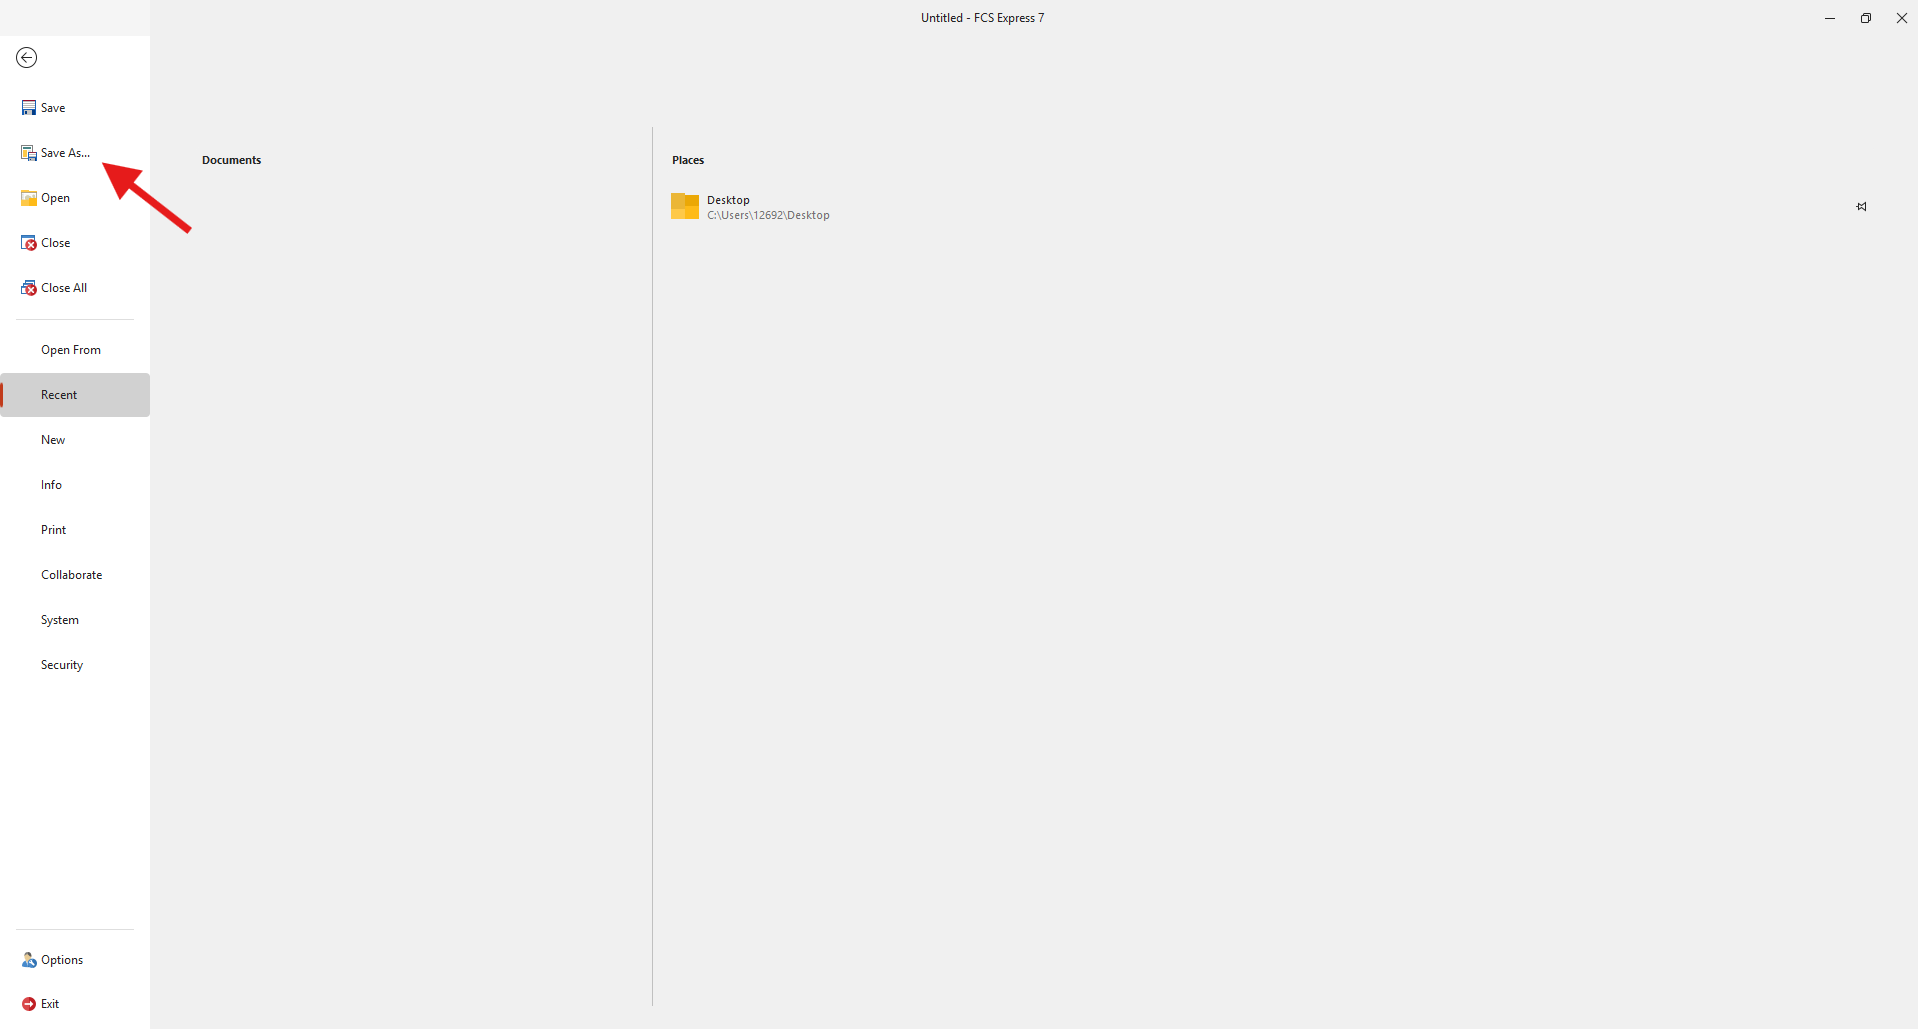
In the file dropdown, select the Save As option.
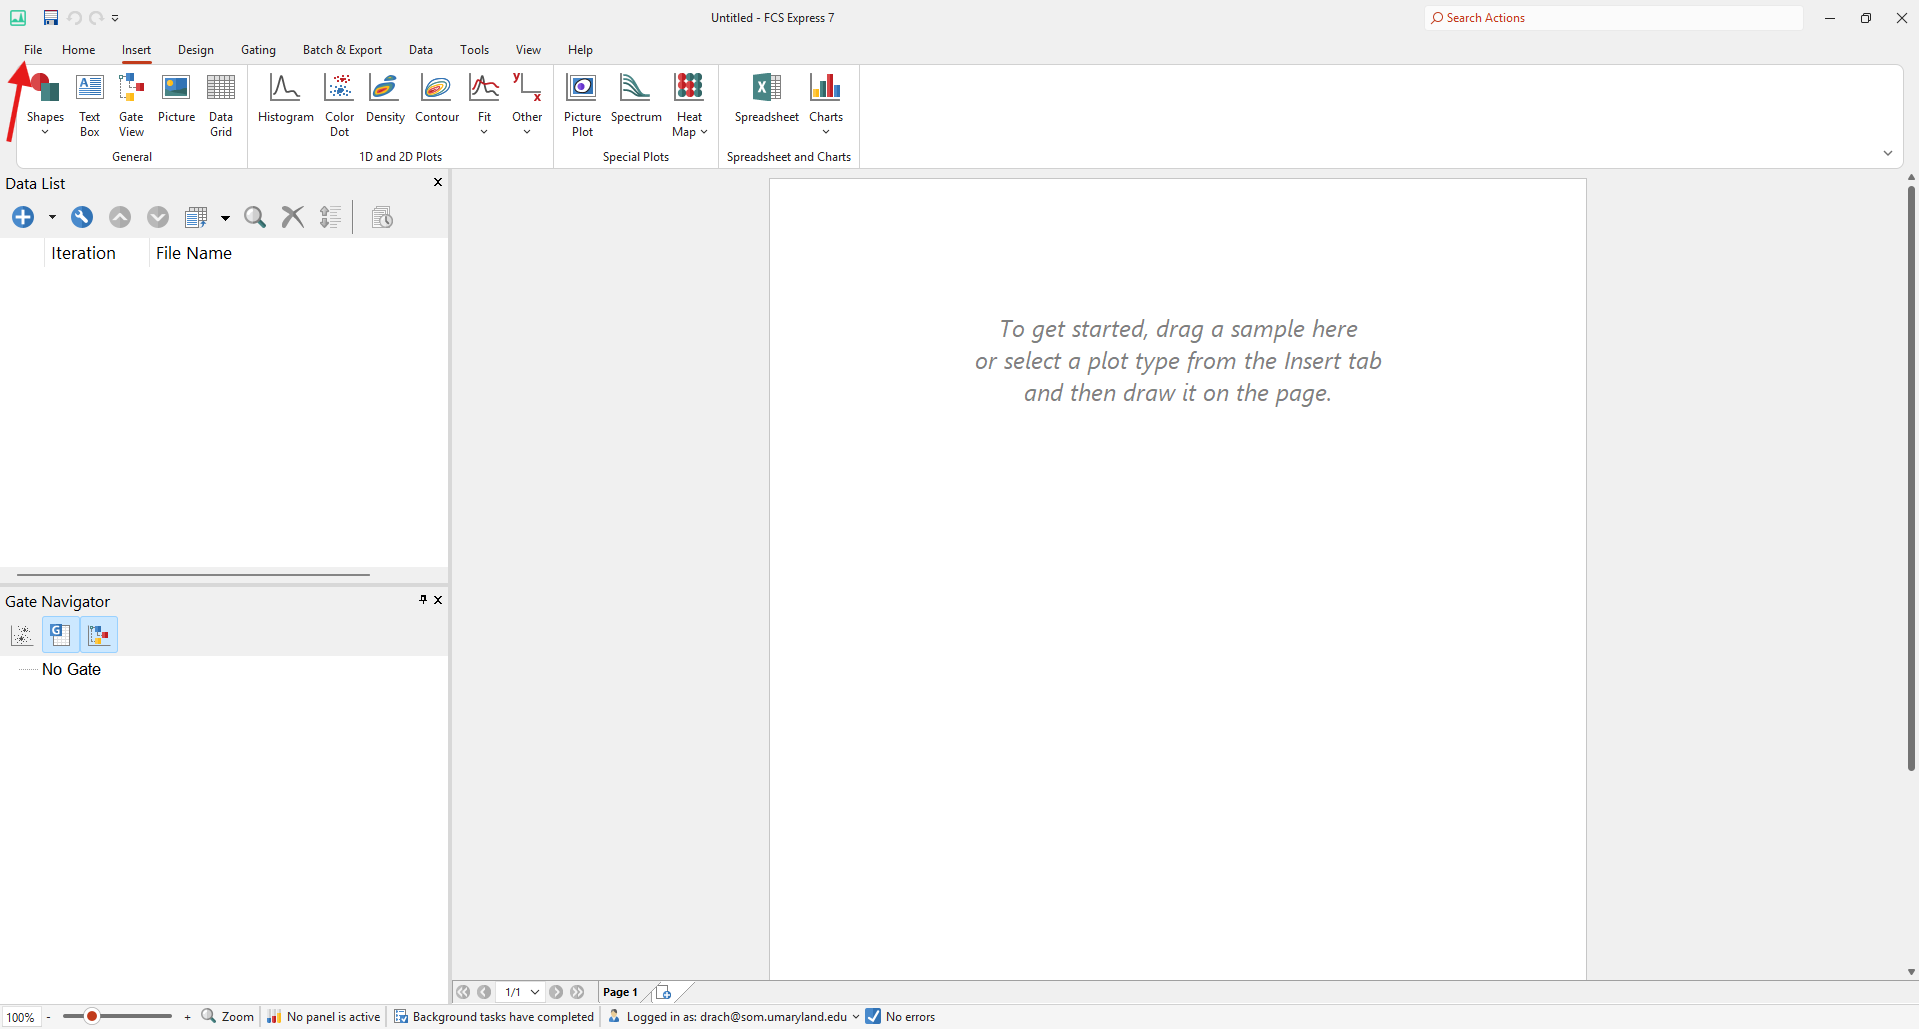
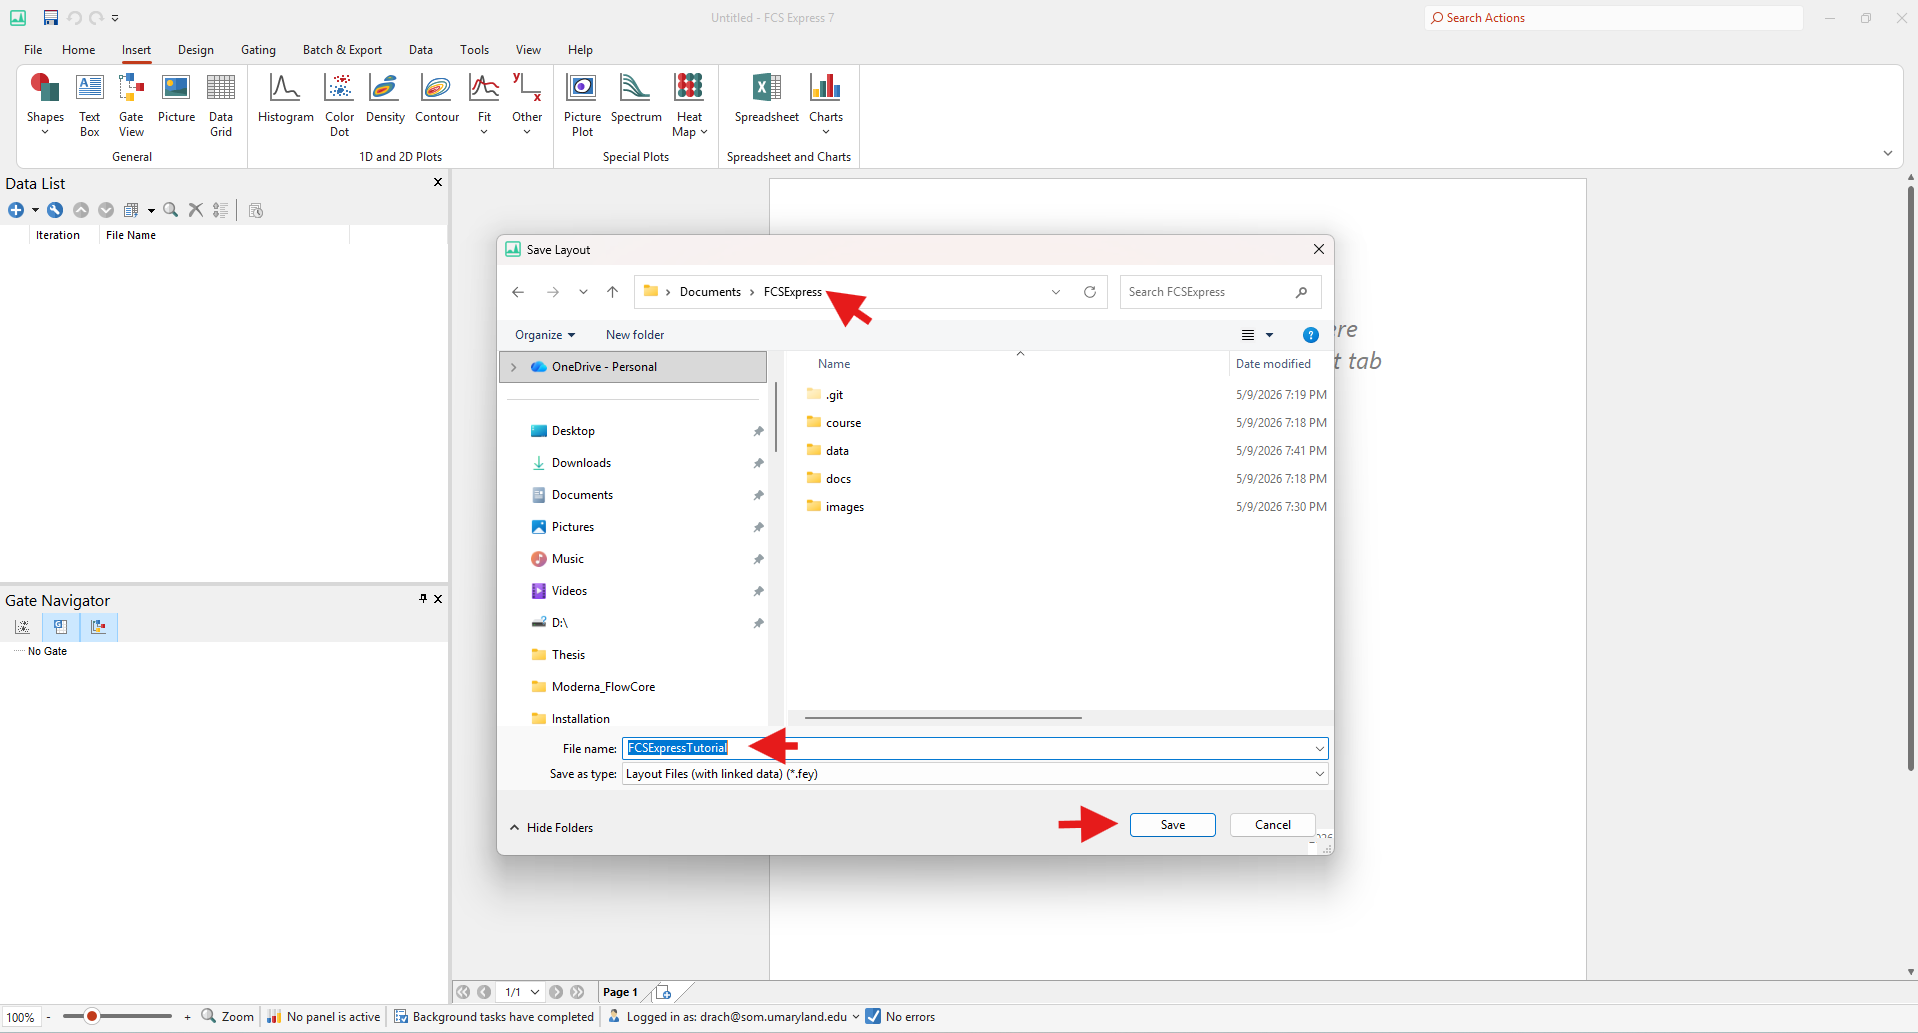
Select the location (folder) on your device where you would like to save your FCS Express files.
Creating Your First Plot
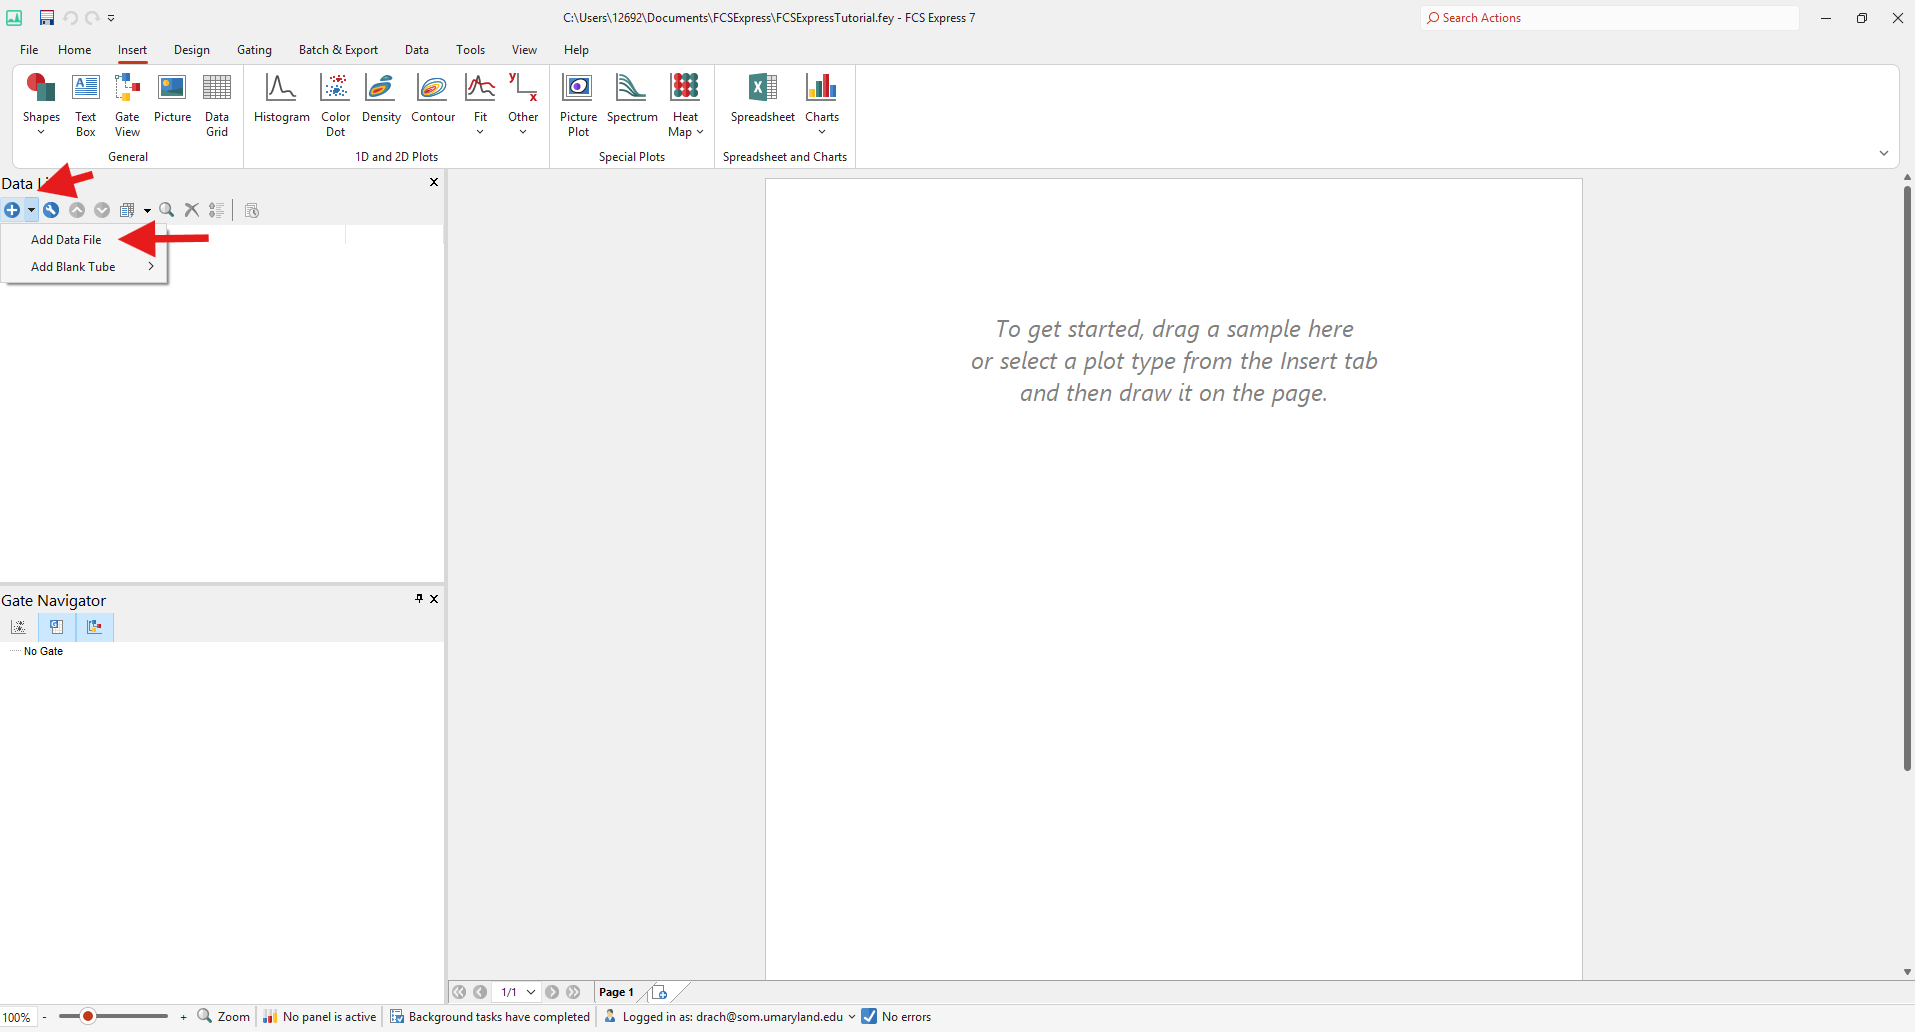
Once you have selected a Save location, select the add data file option within the data list menu.
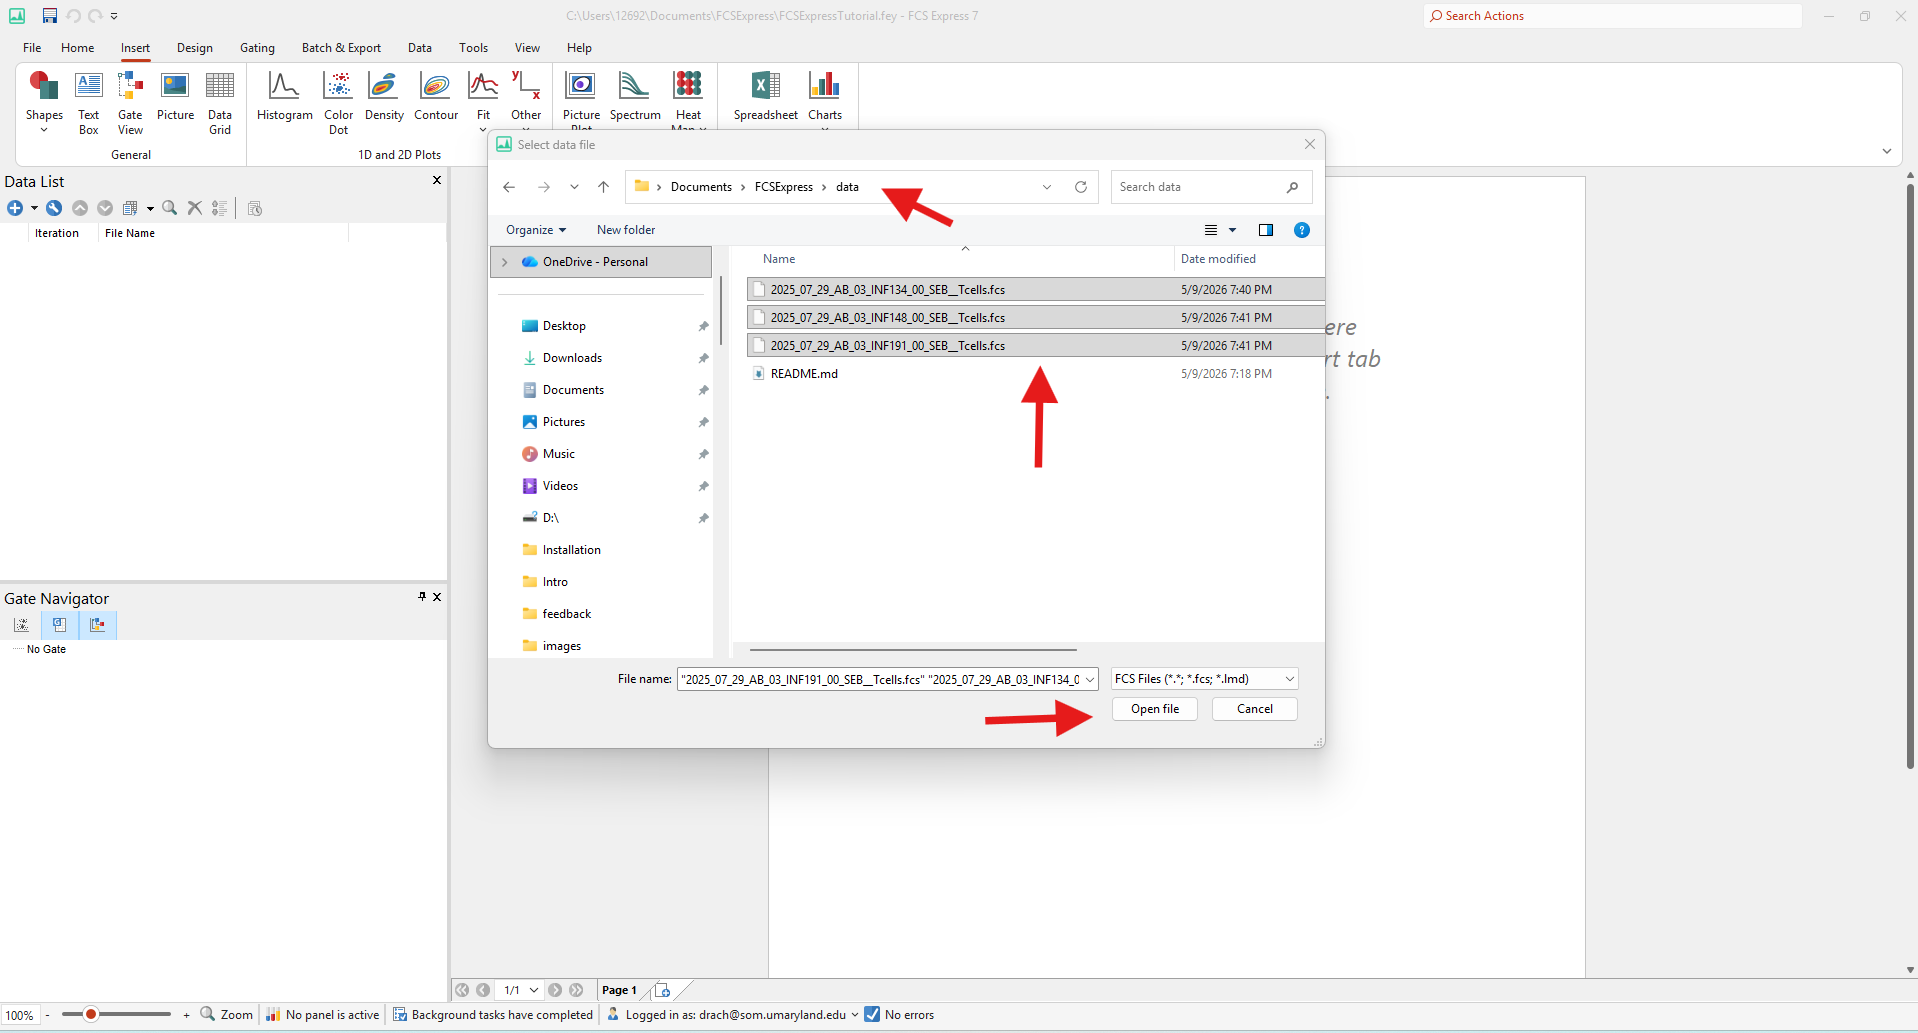
Select the data files (.fcs format) which you wish to use, and open them.
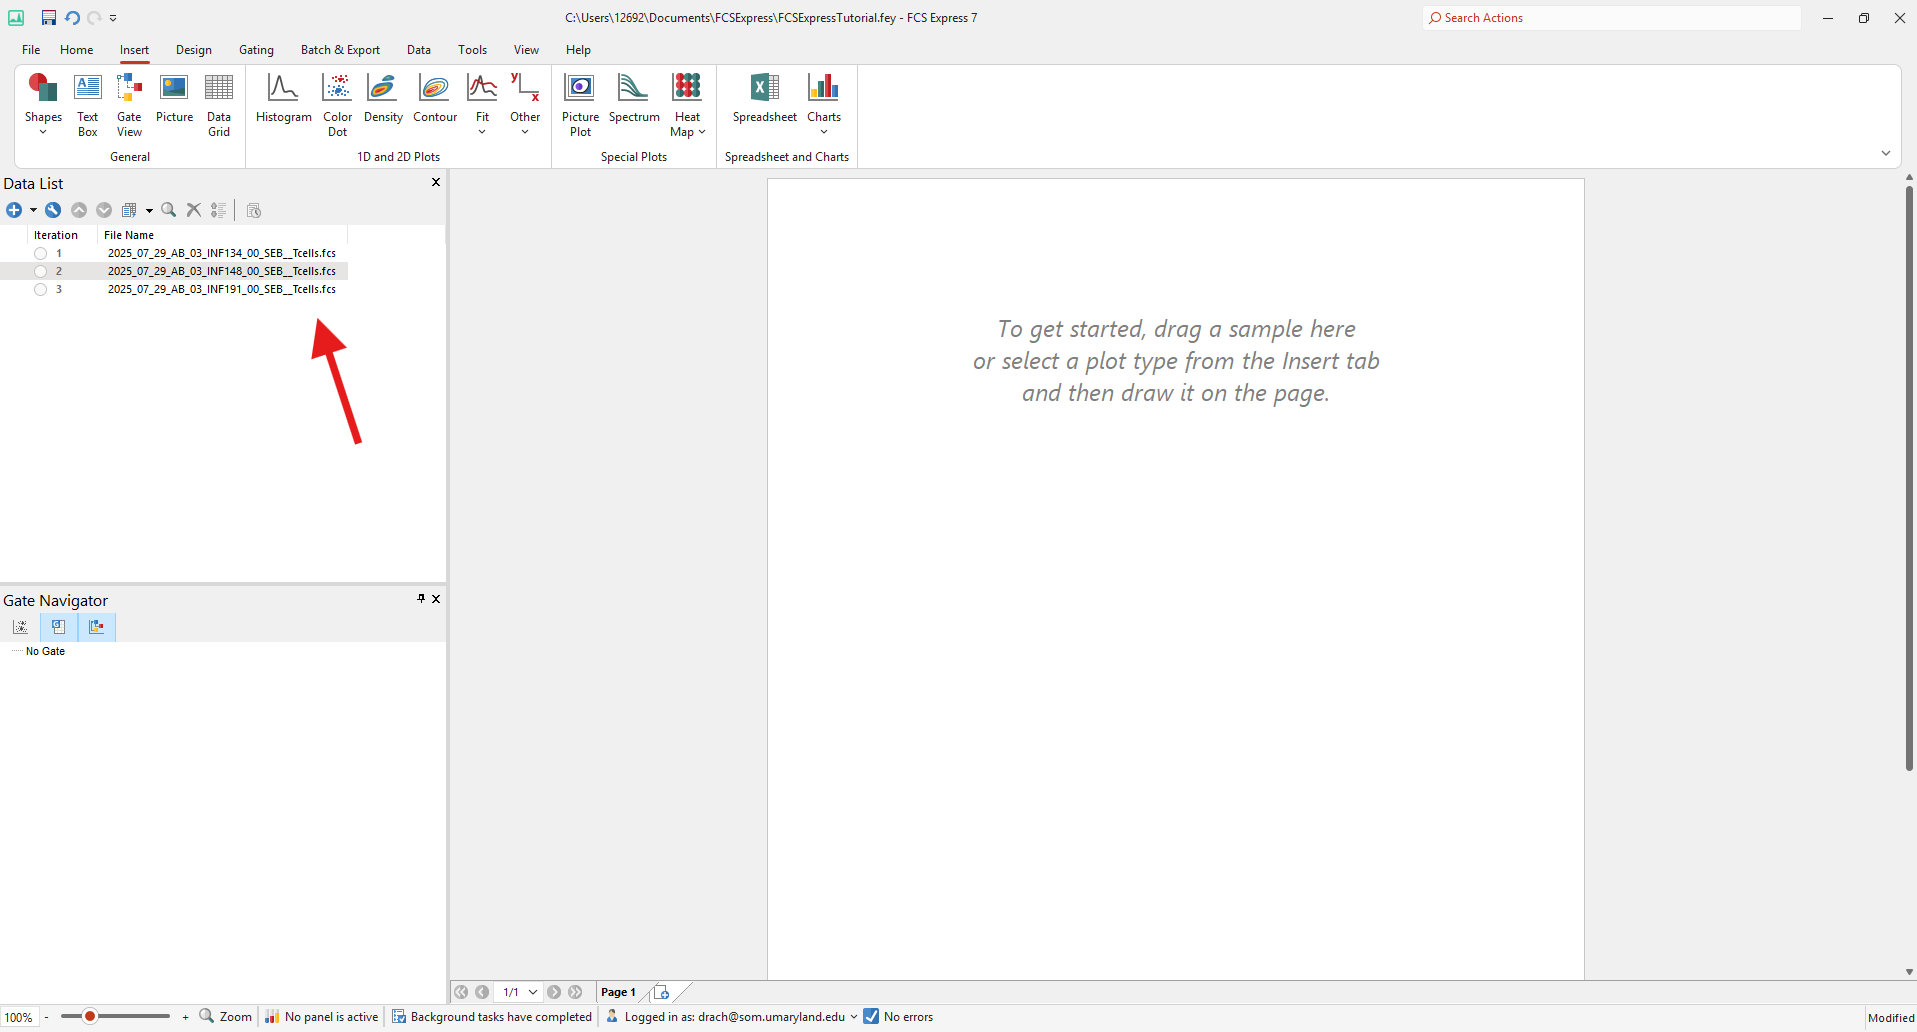
Once your data files have loaded, select a file you wish to analyze and click on the density plot option
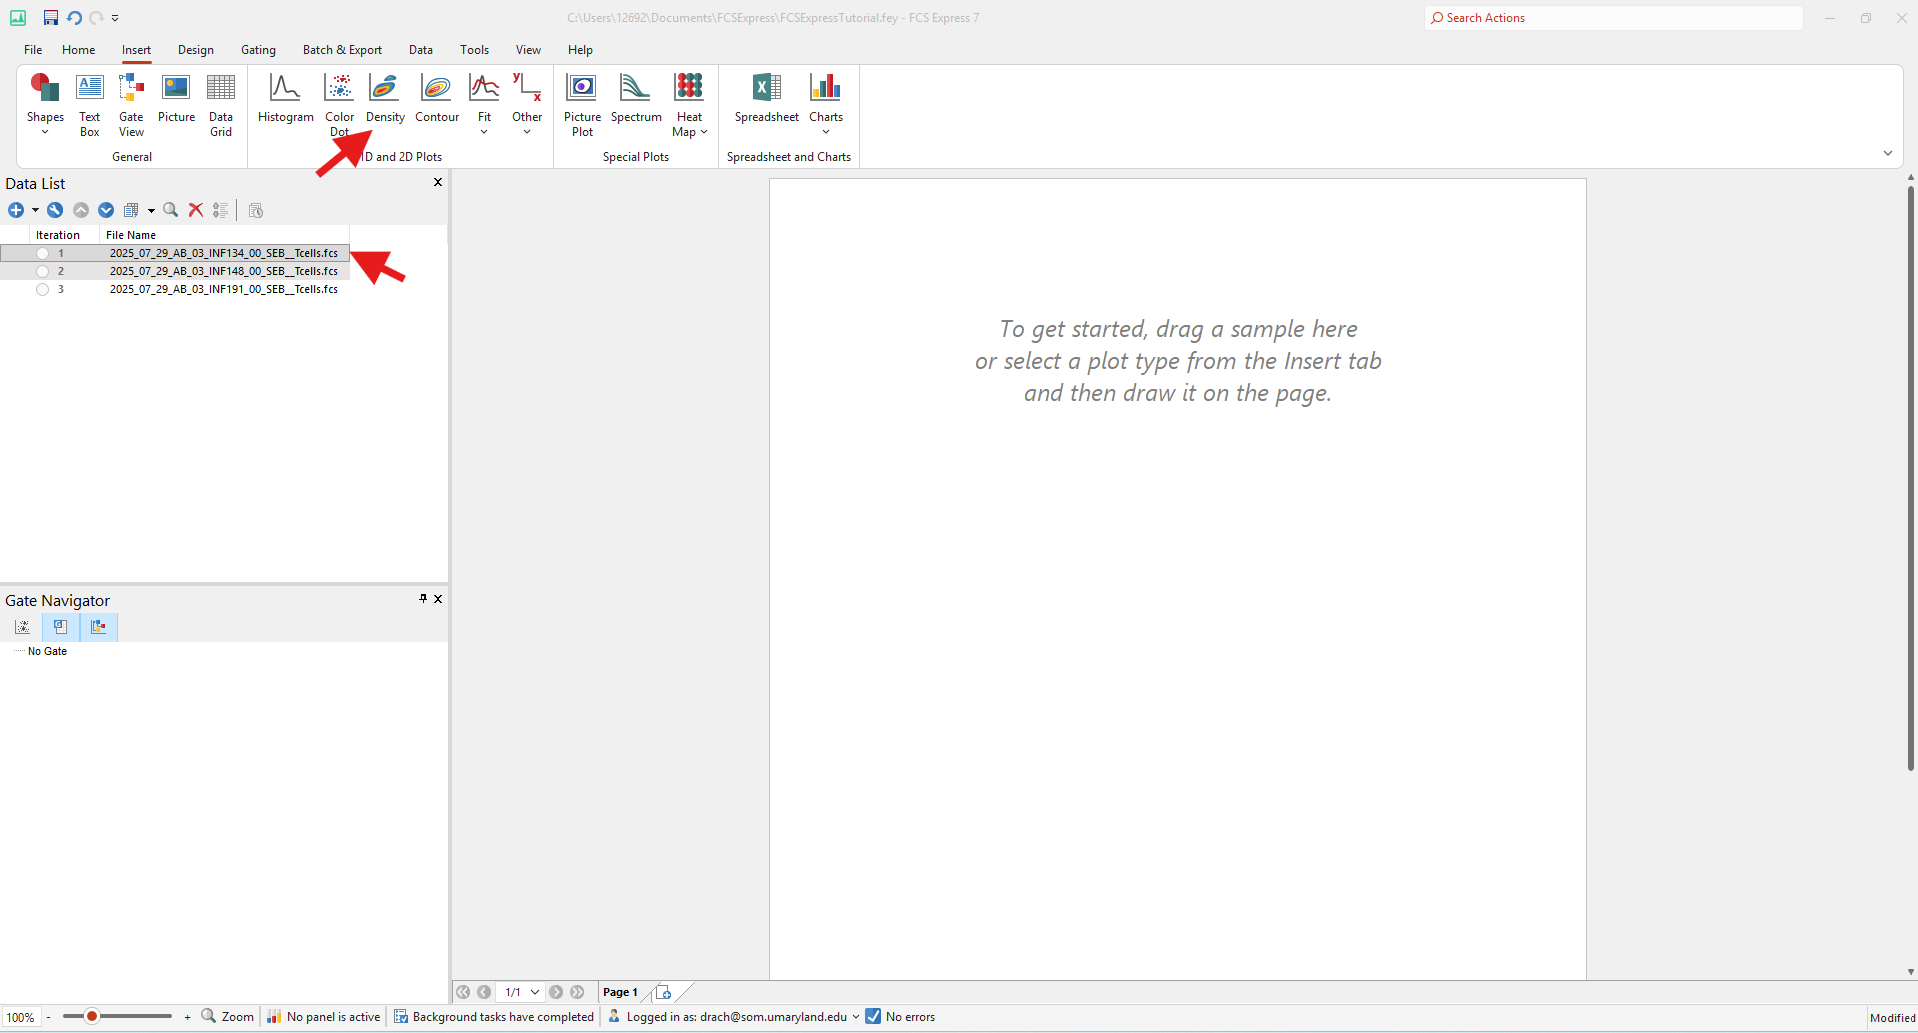
Click and drag anywhere within the page to open a density plot of the data file you have selected
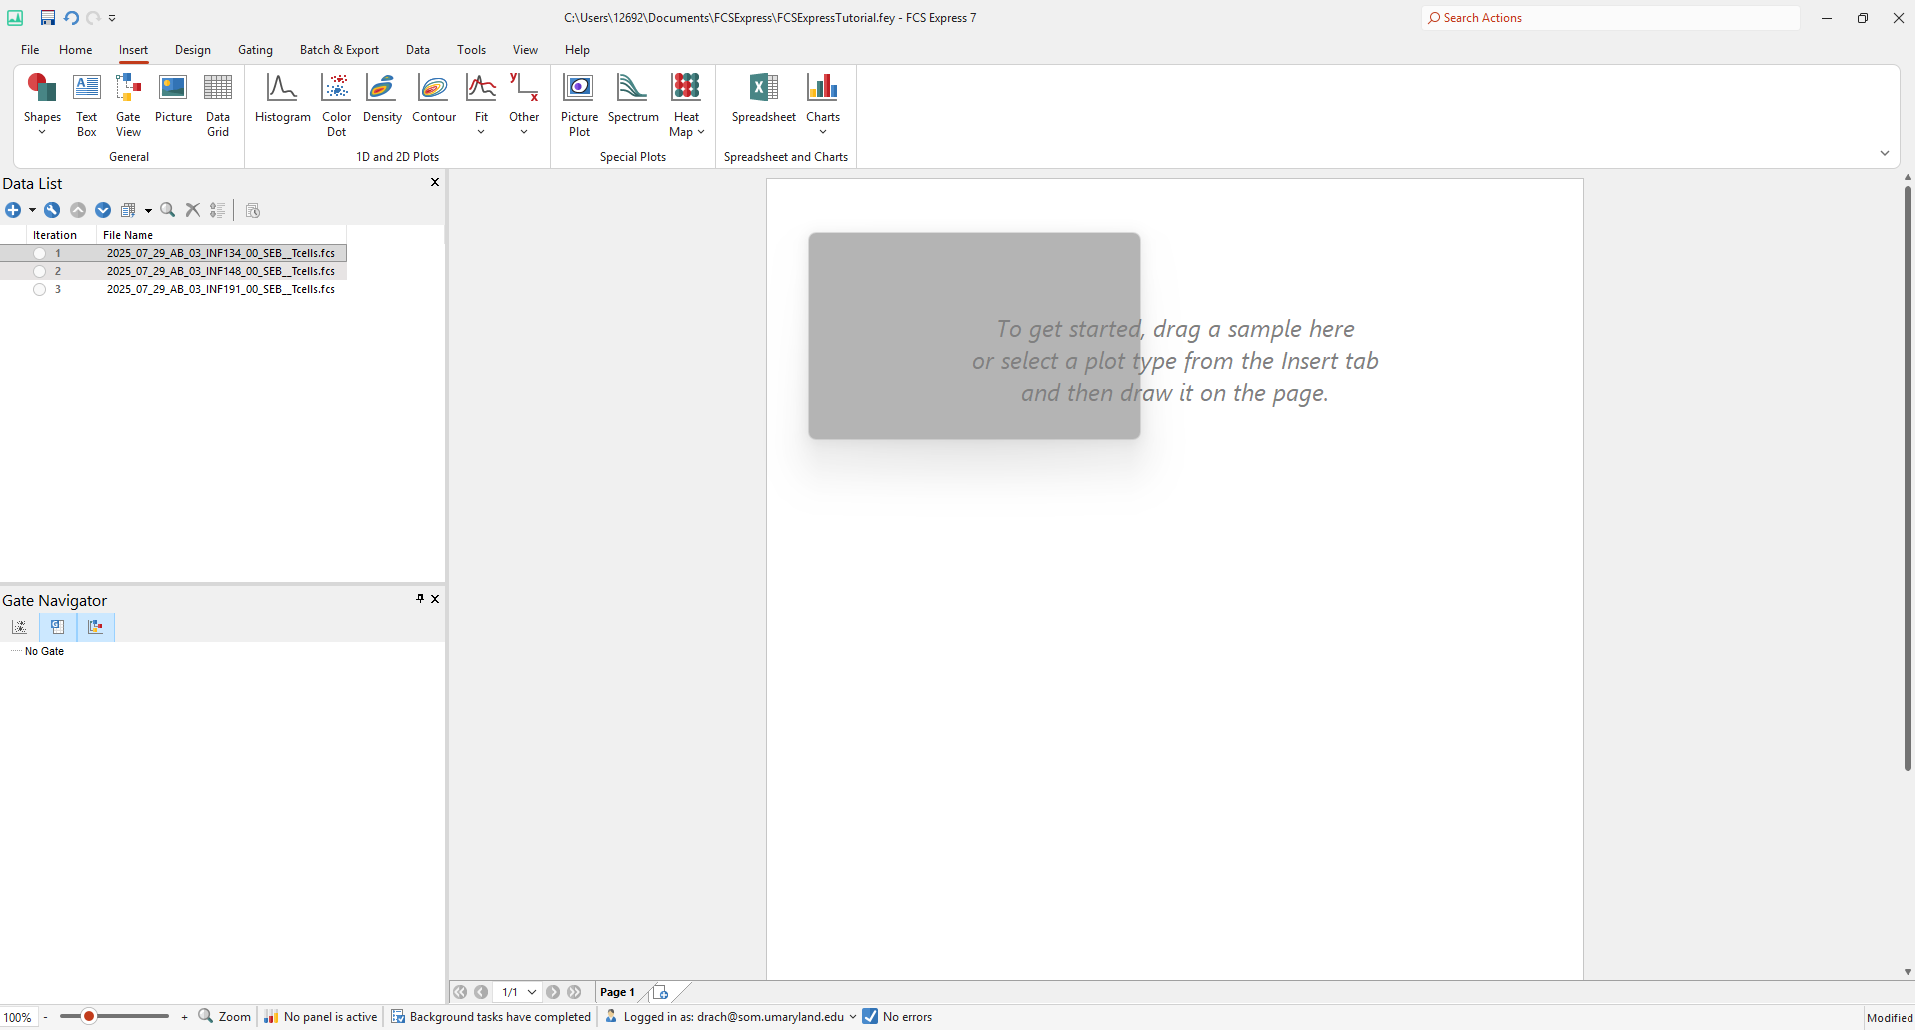
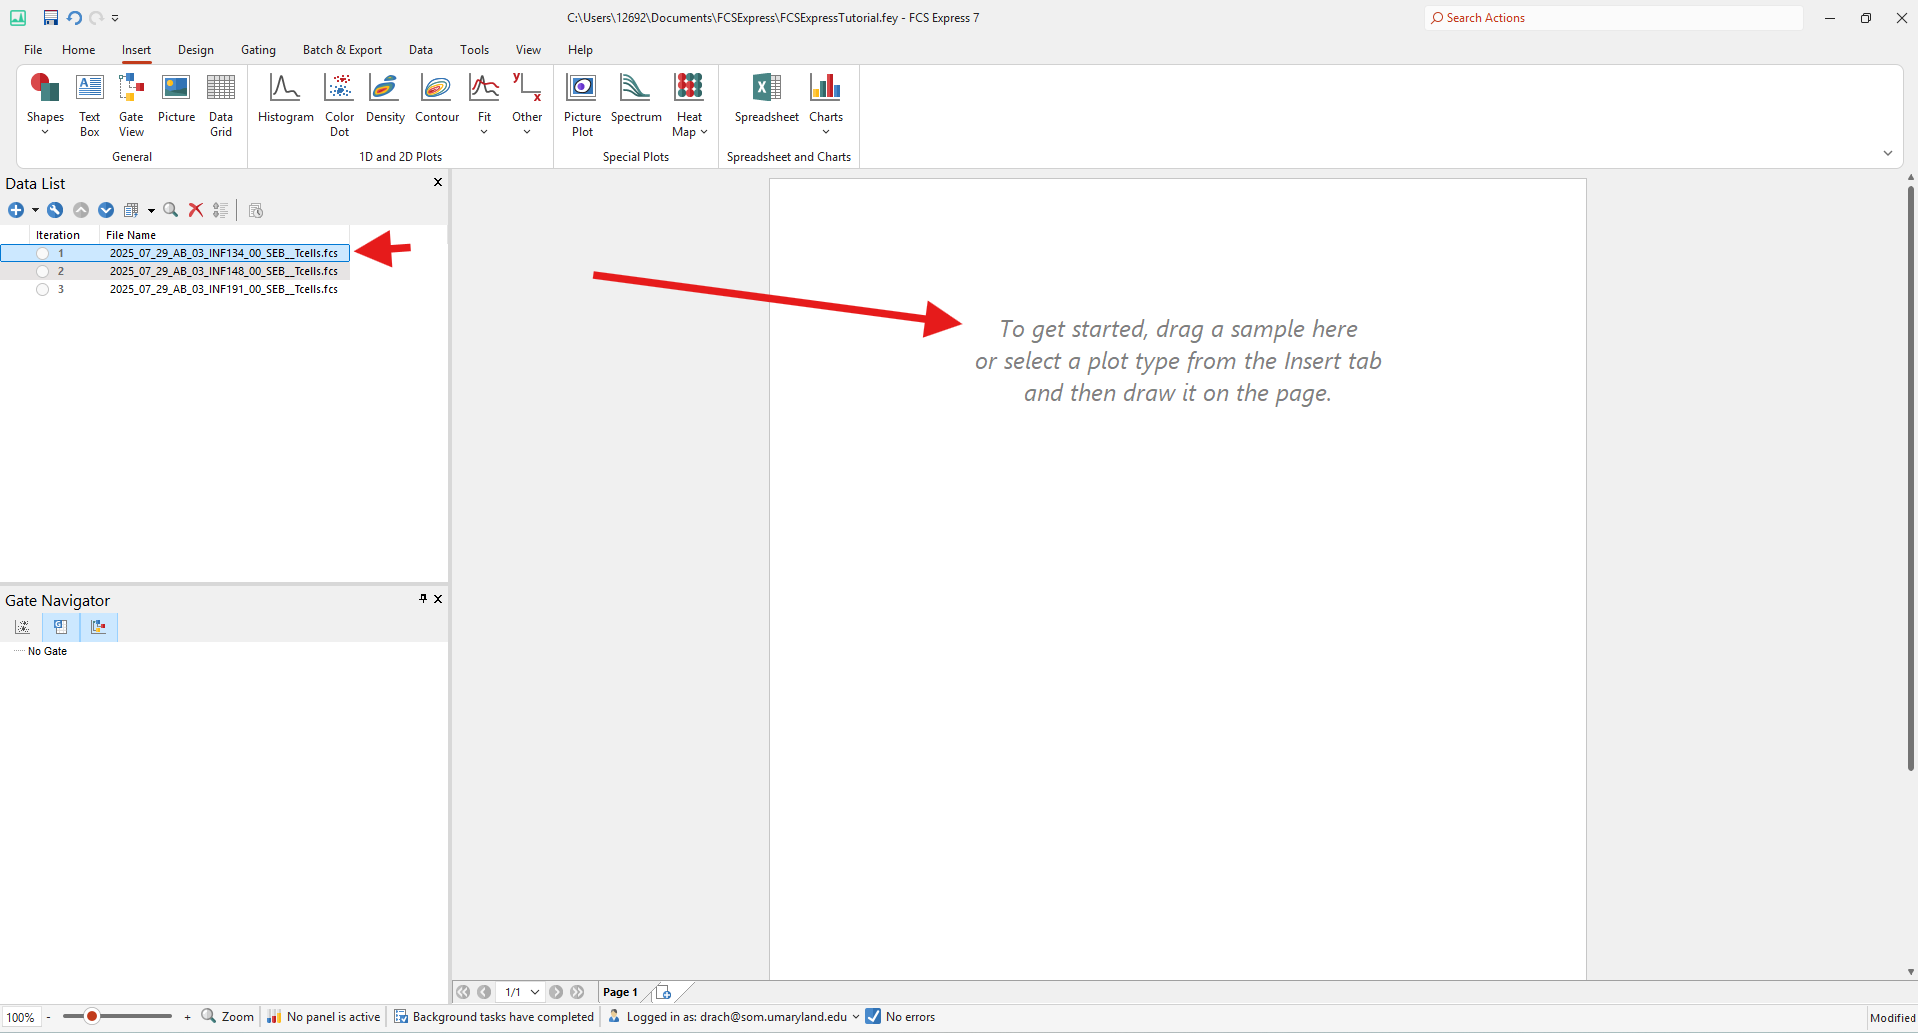
You can also create a plot by first selecting the data file, and dragging that highlighted data file into the page area
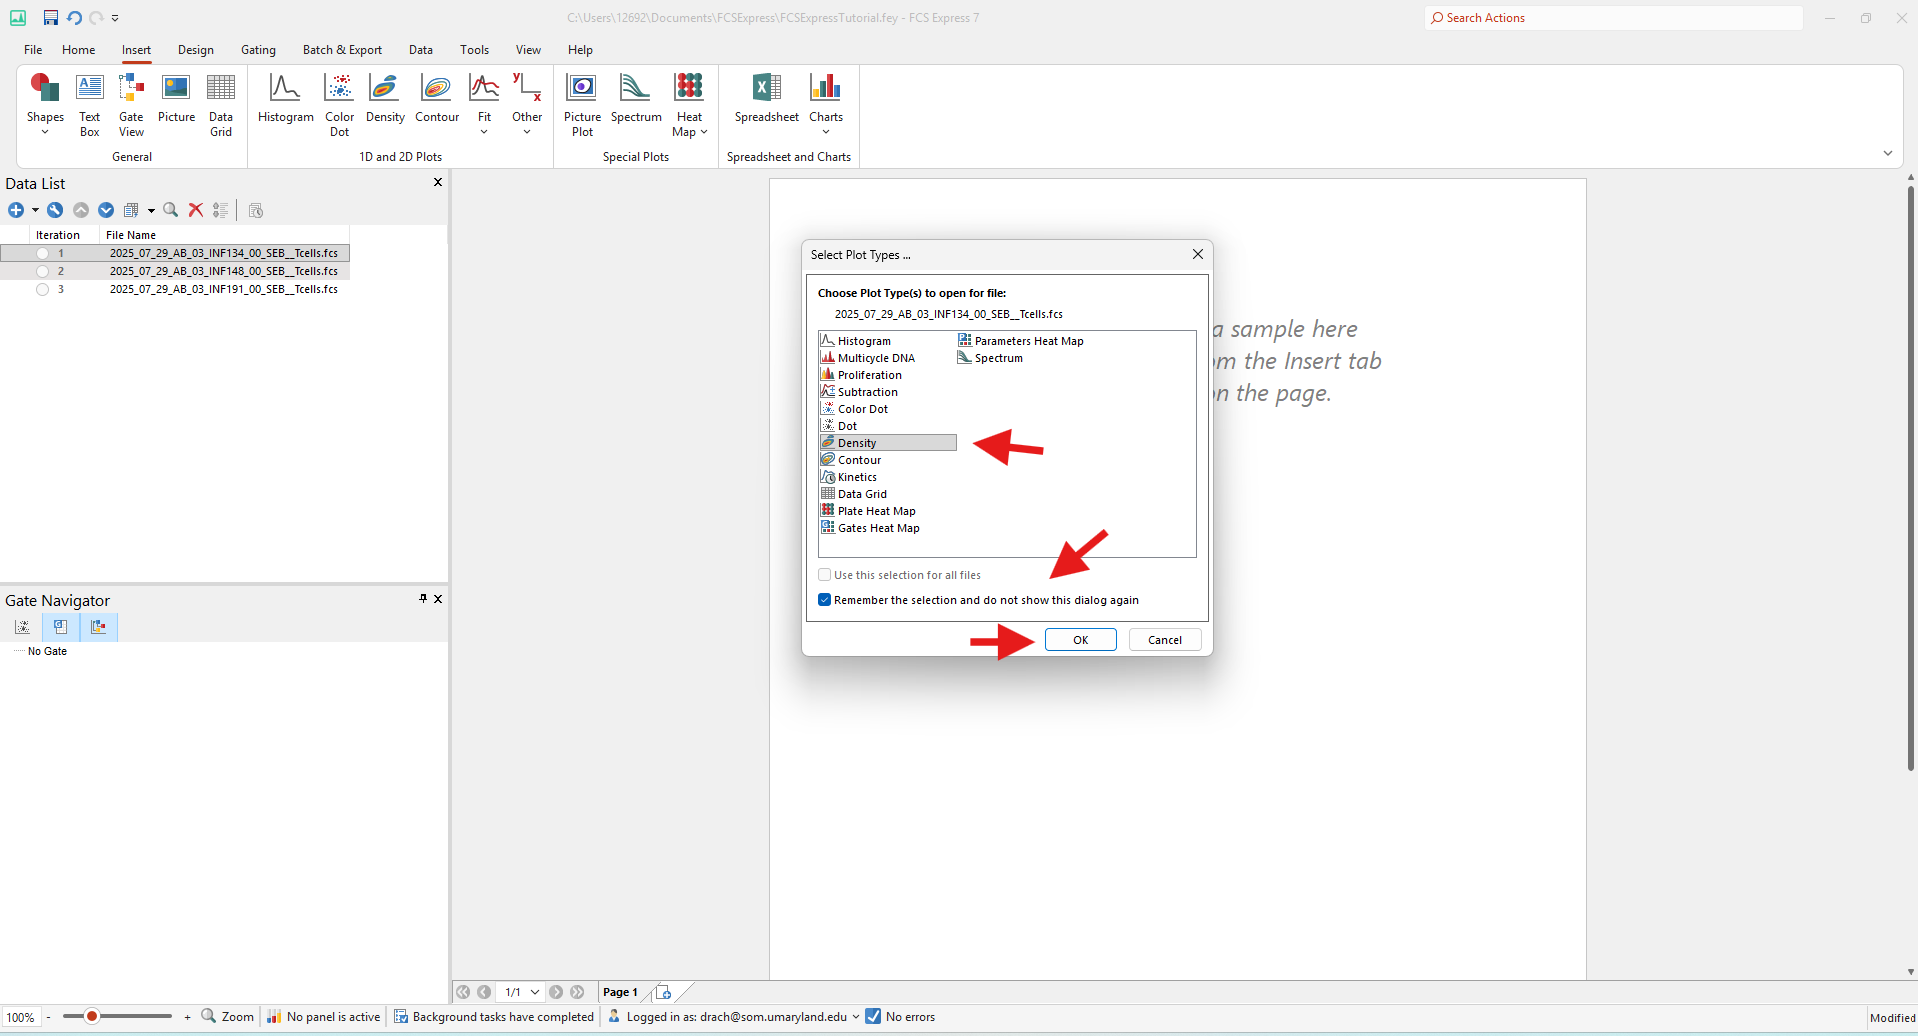
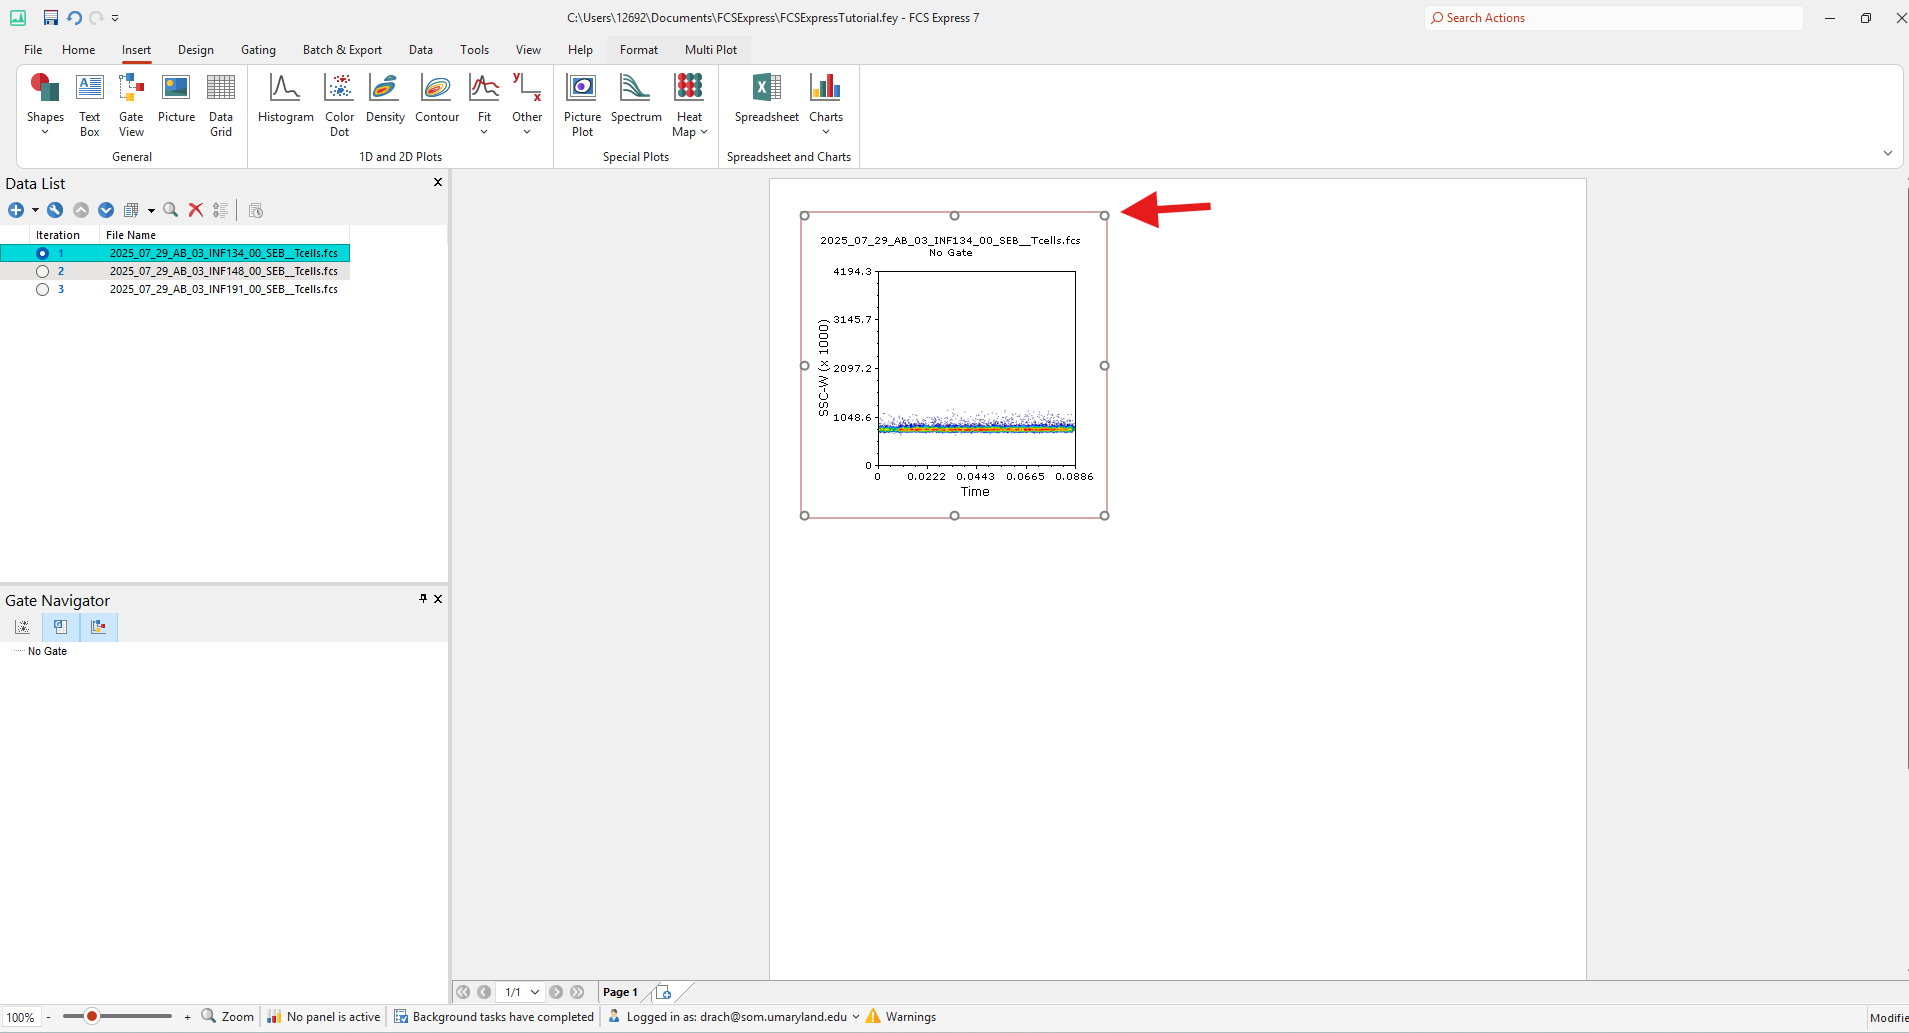
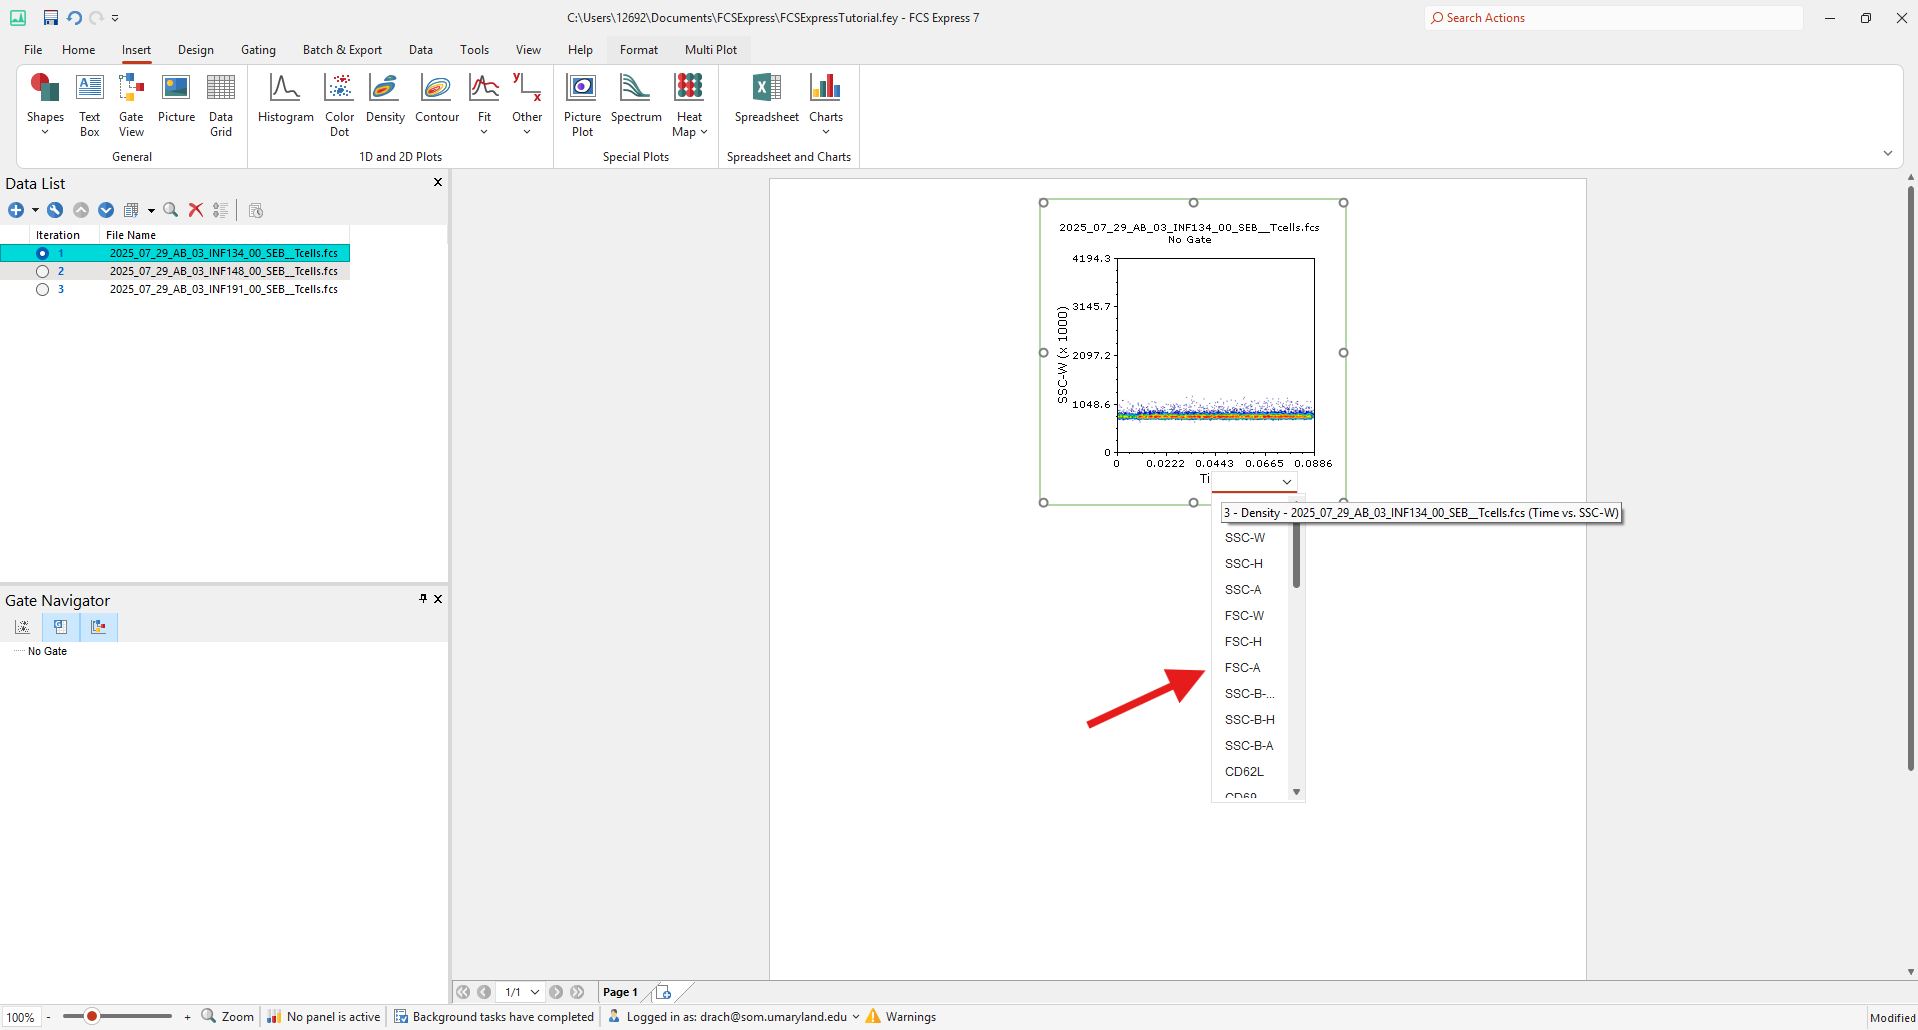
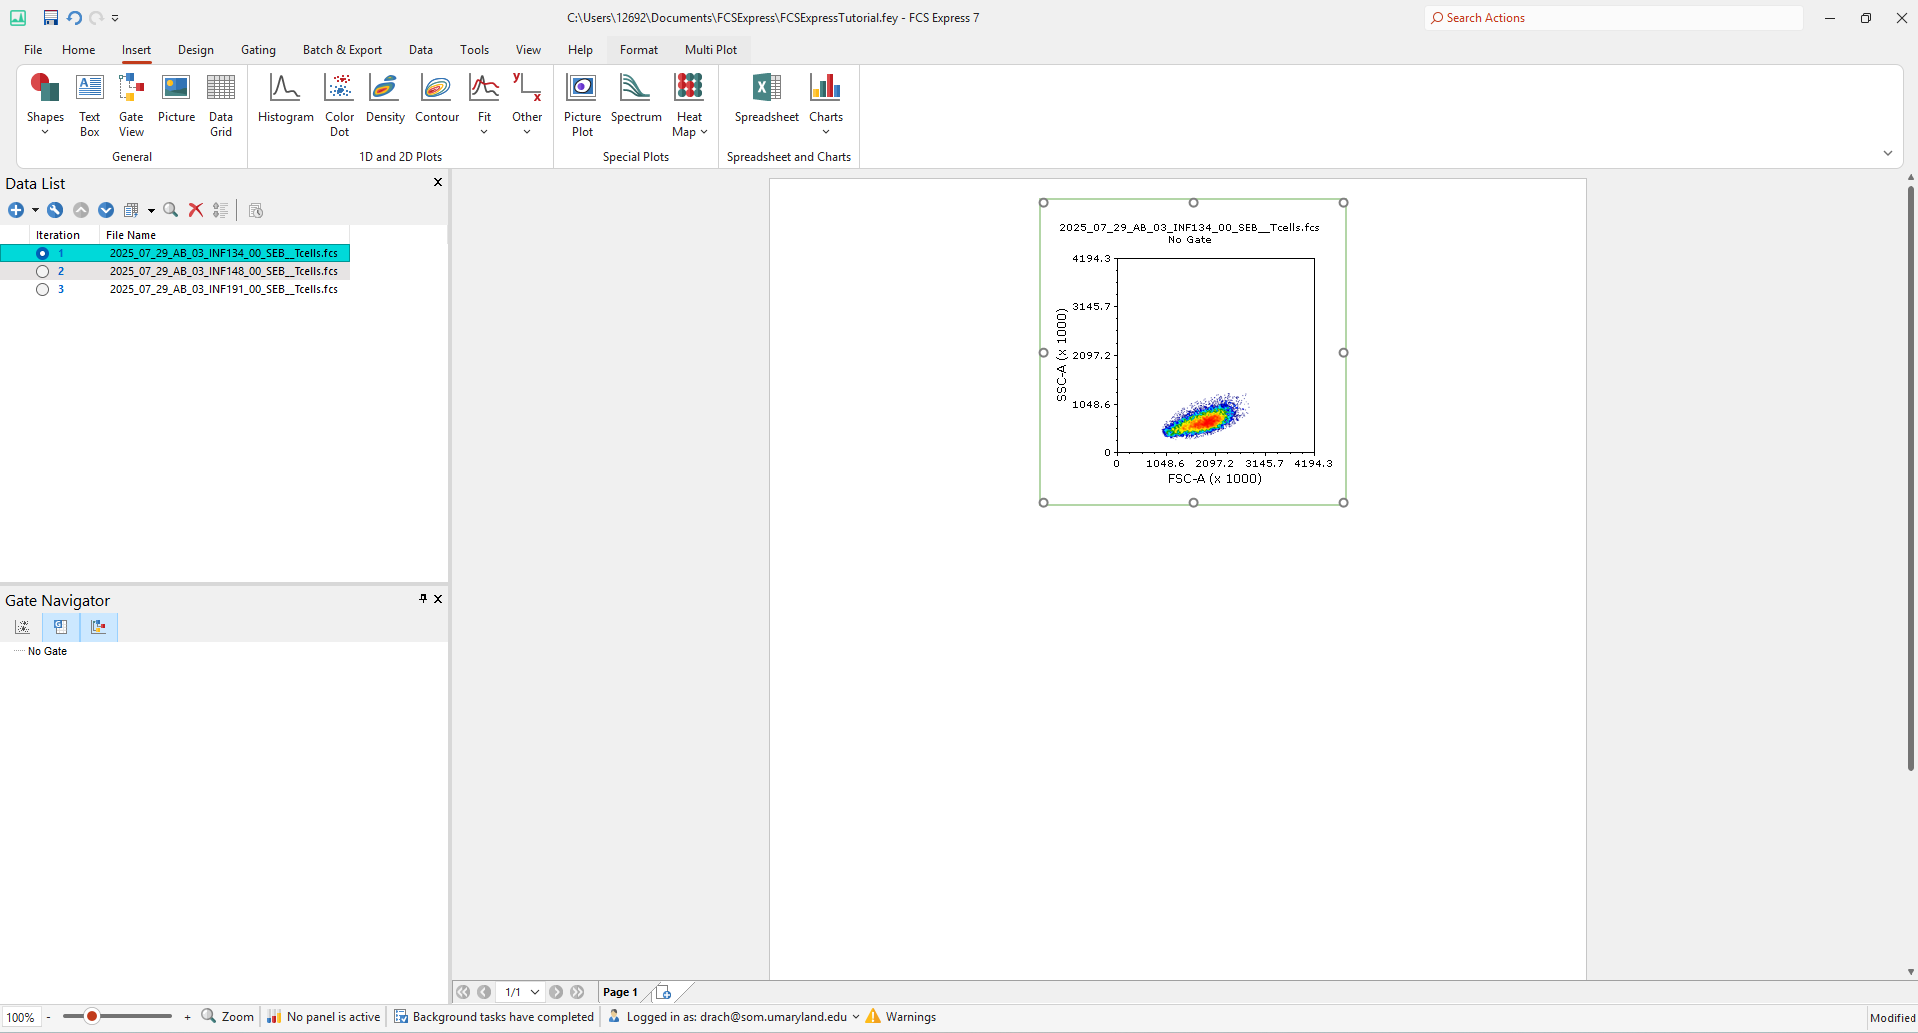
Once you have created a graph, you may click on the axis labels to switch the axis to another parameter of your data. For your first graph, select FSC-A for the X axis.
Click the label for the Y axis, and select for SSC-A to be displayed on that axis.
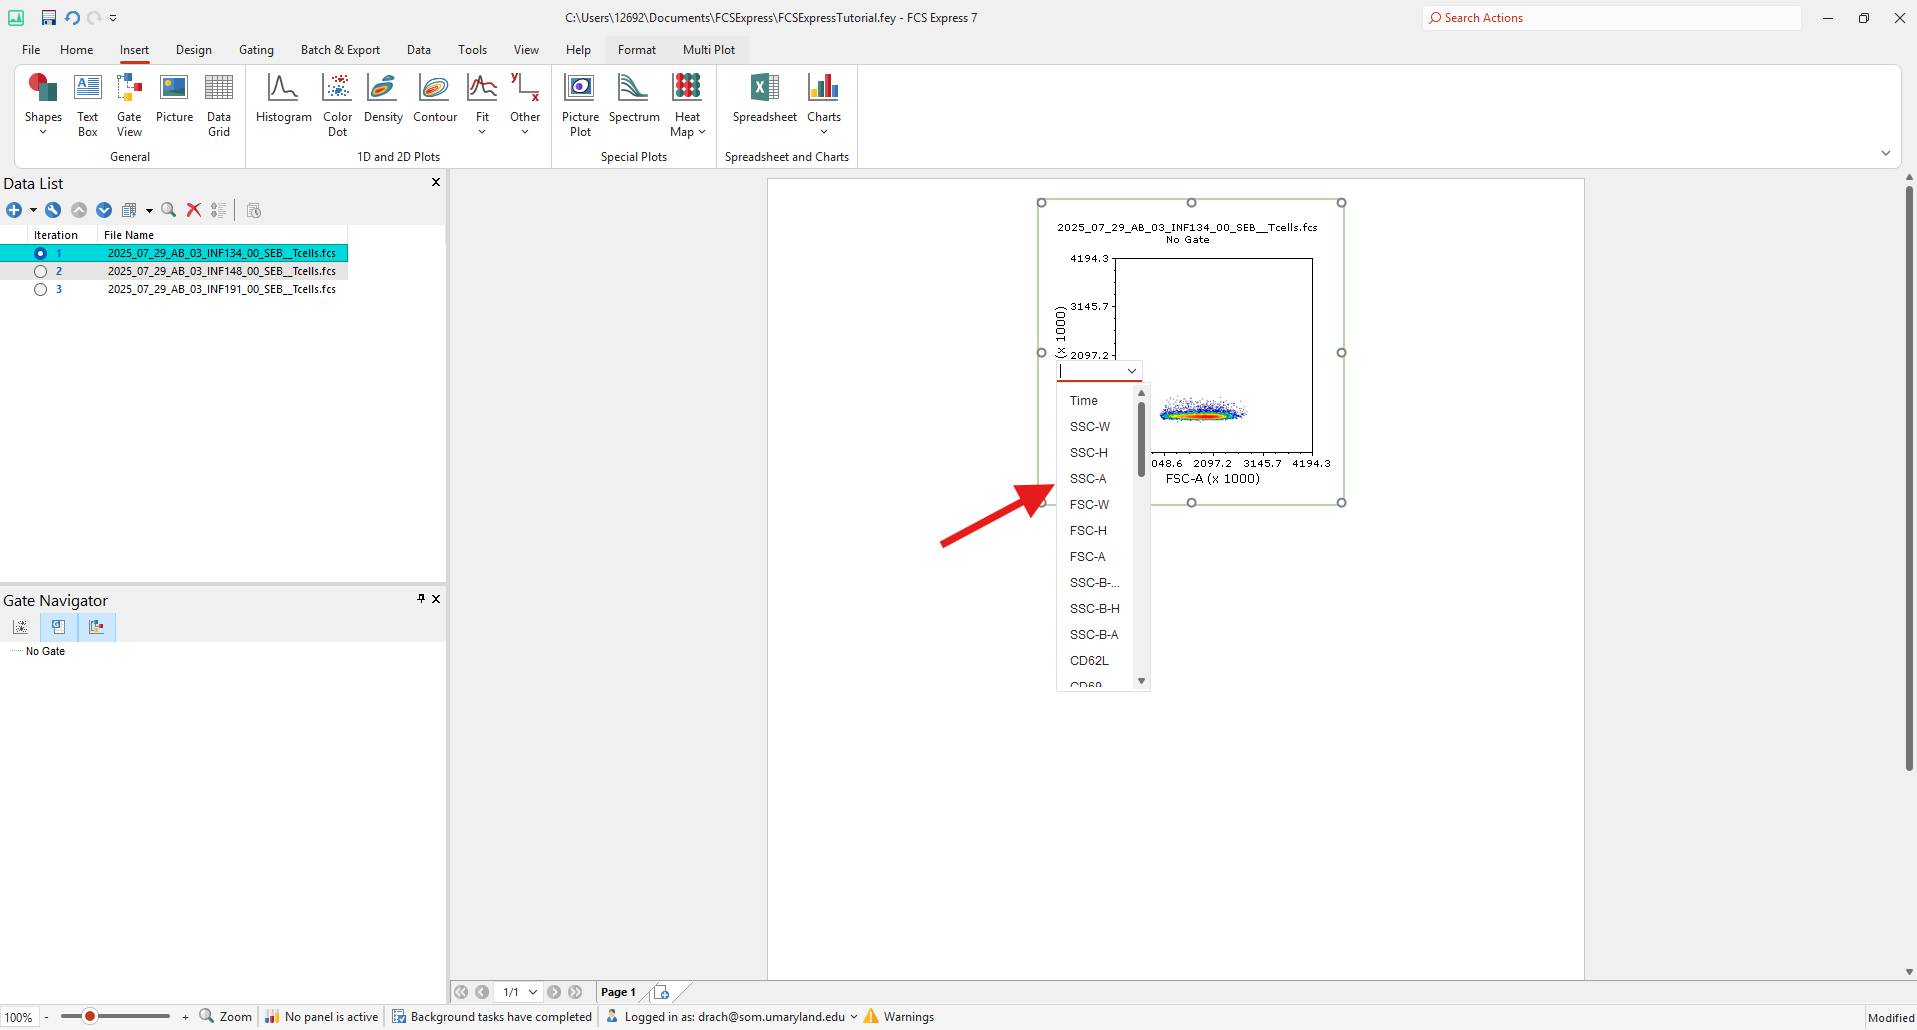
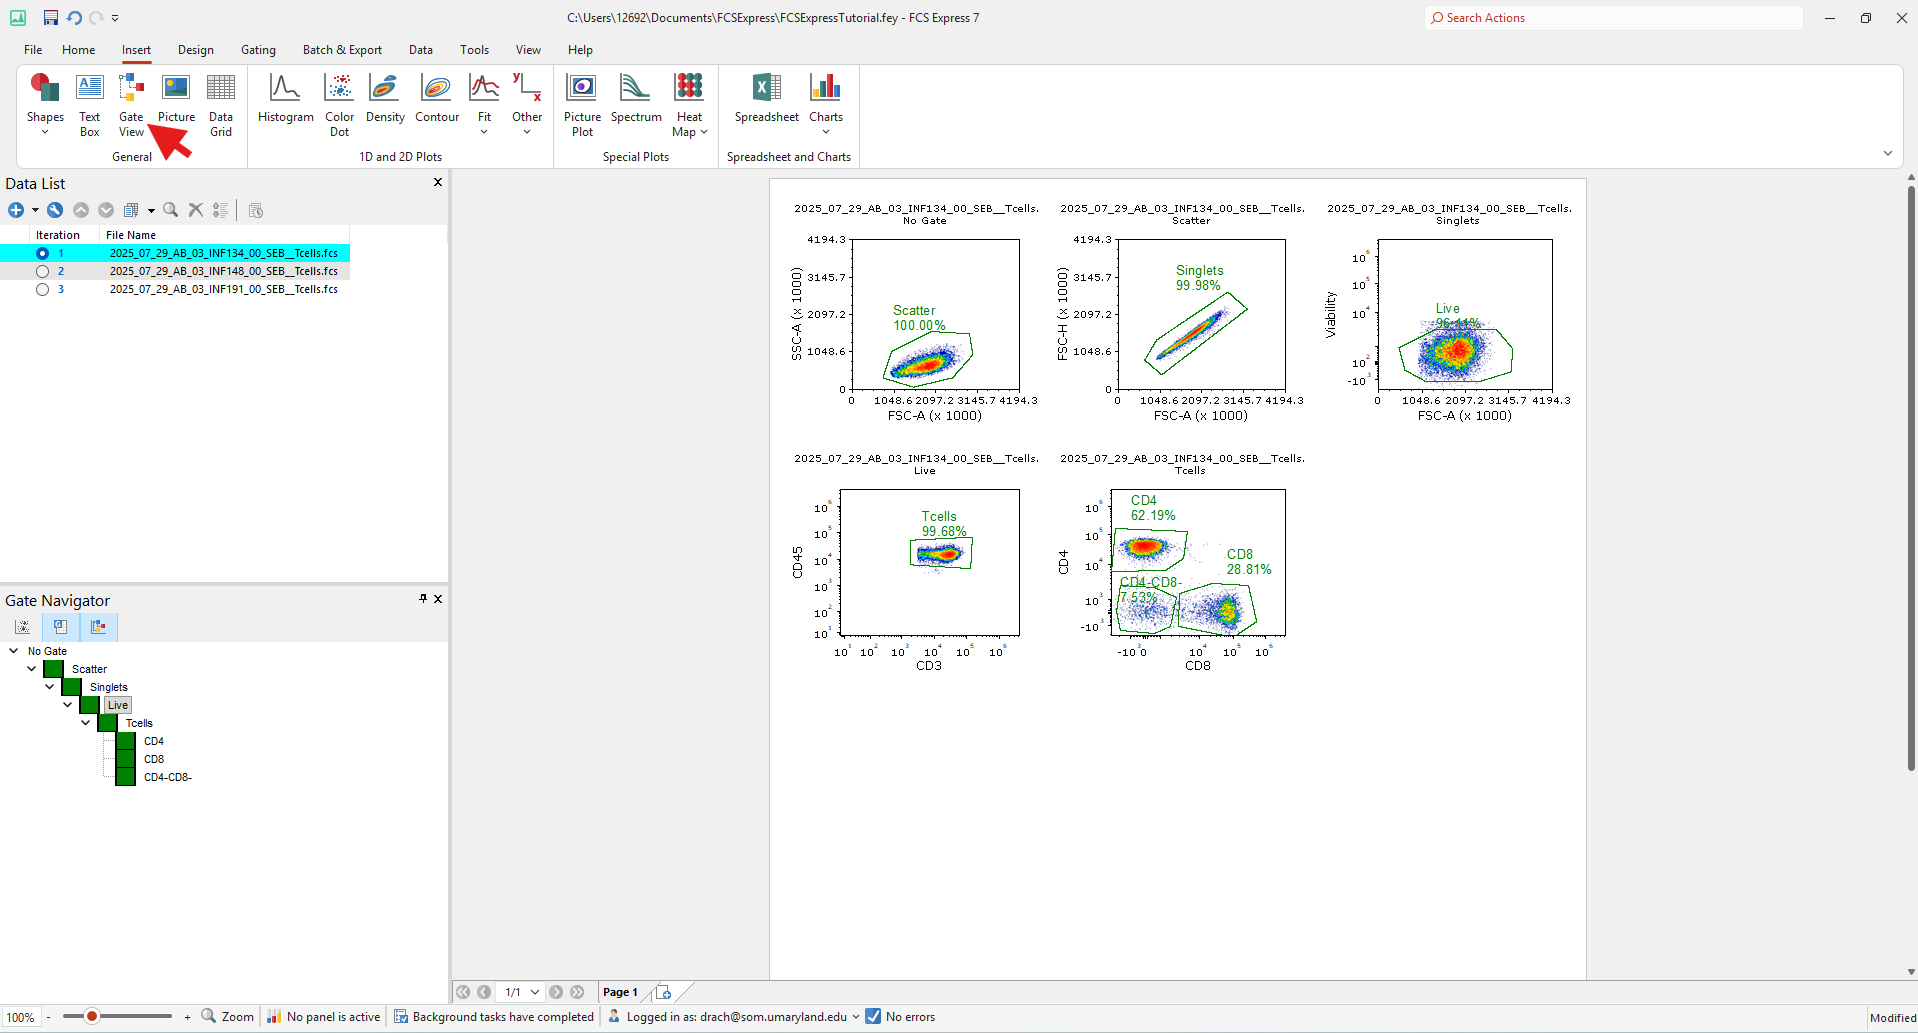
Now you have created your first plot. It should look something like this:
Gating
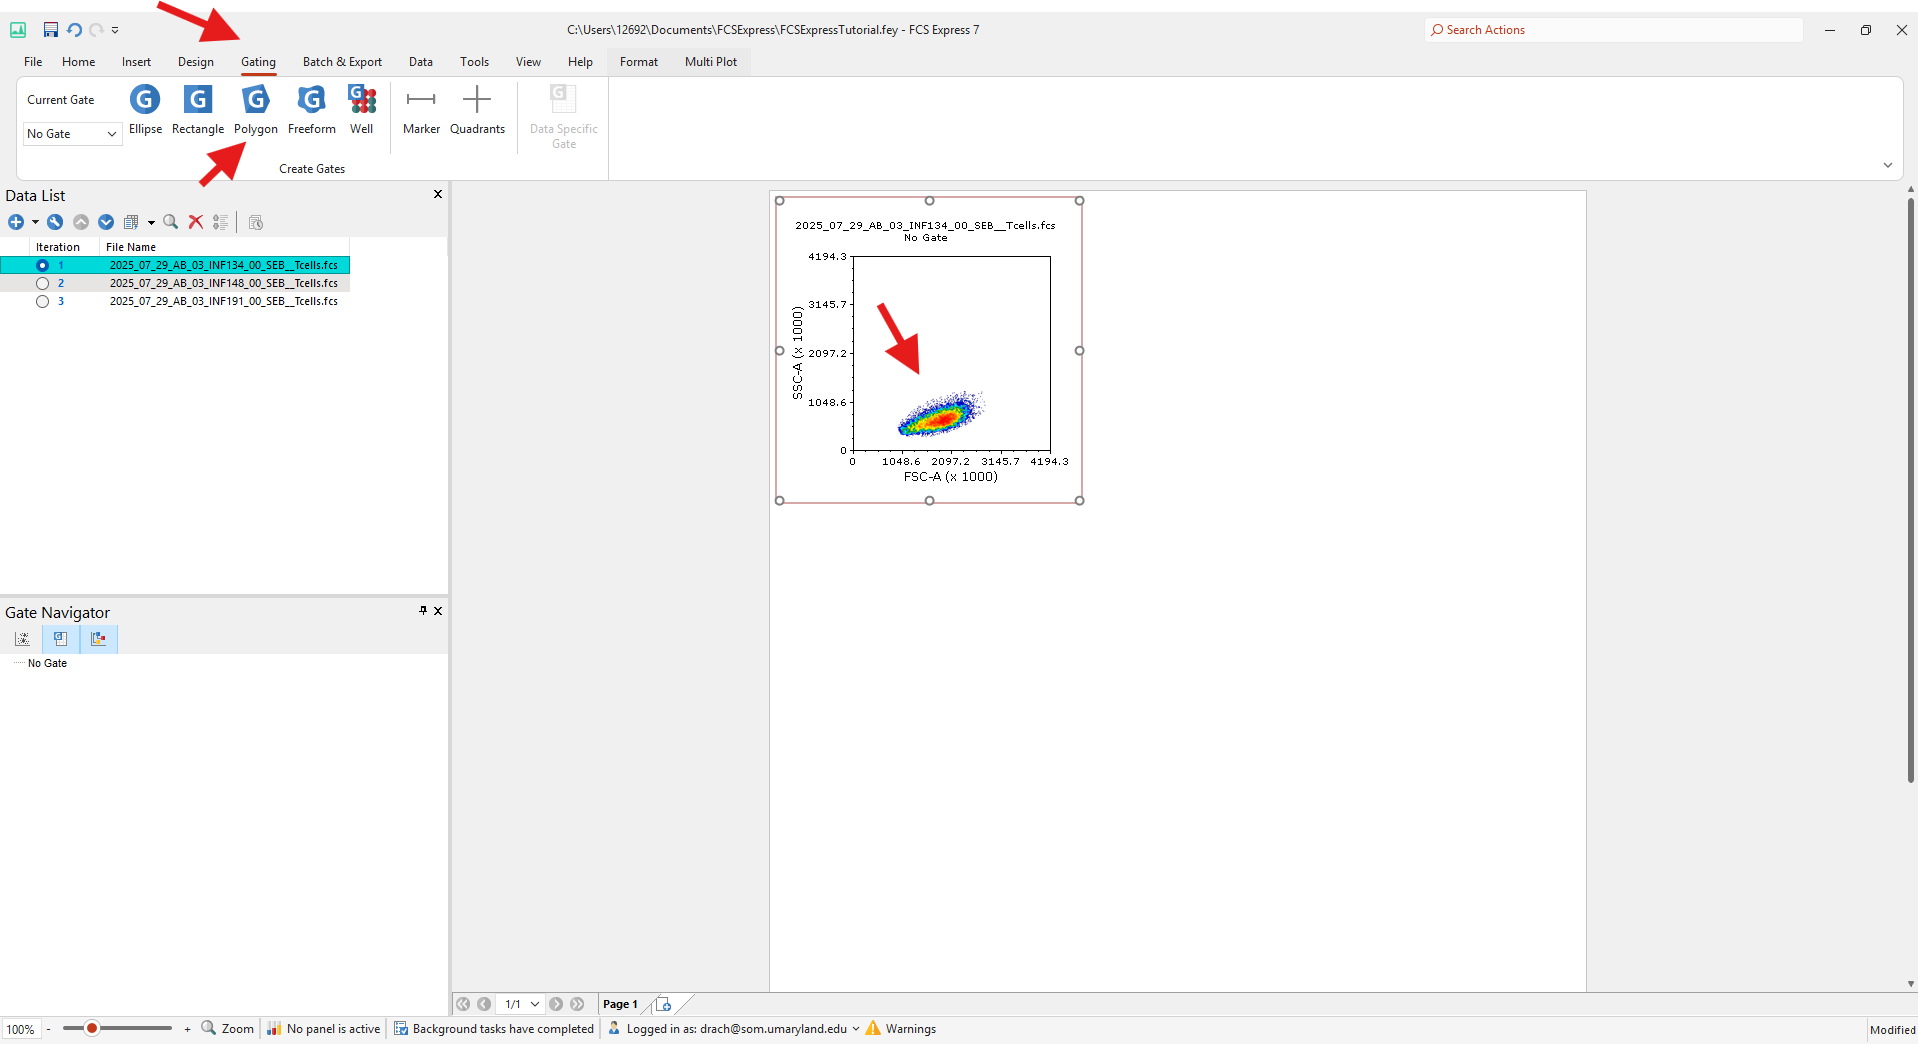
Now that you have created your first plot, navigate to the Gating menu in the top ribbon. In the gating menu, click on the Polygon gate option
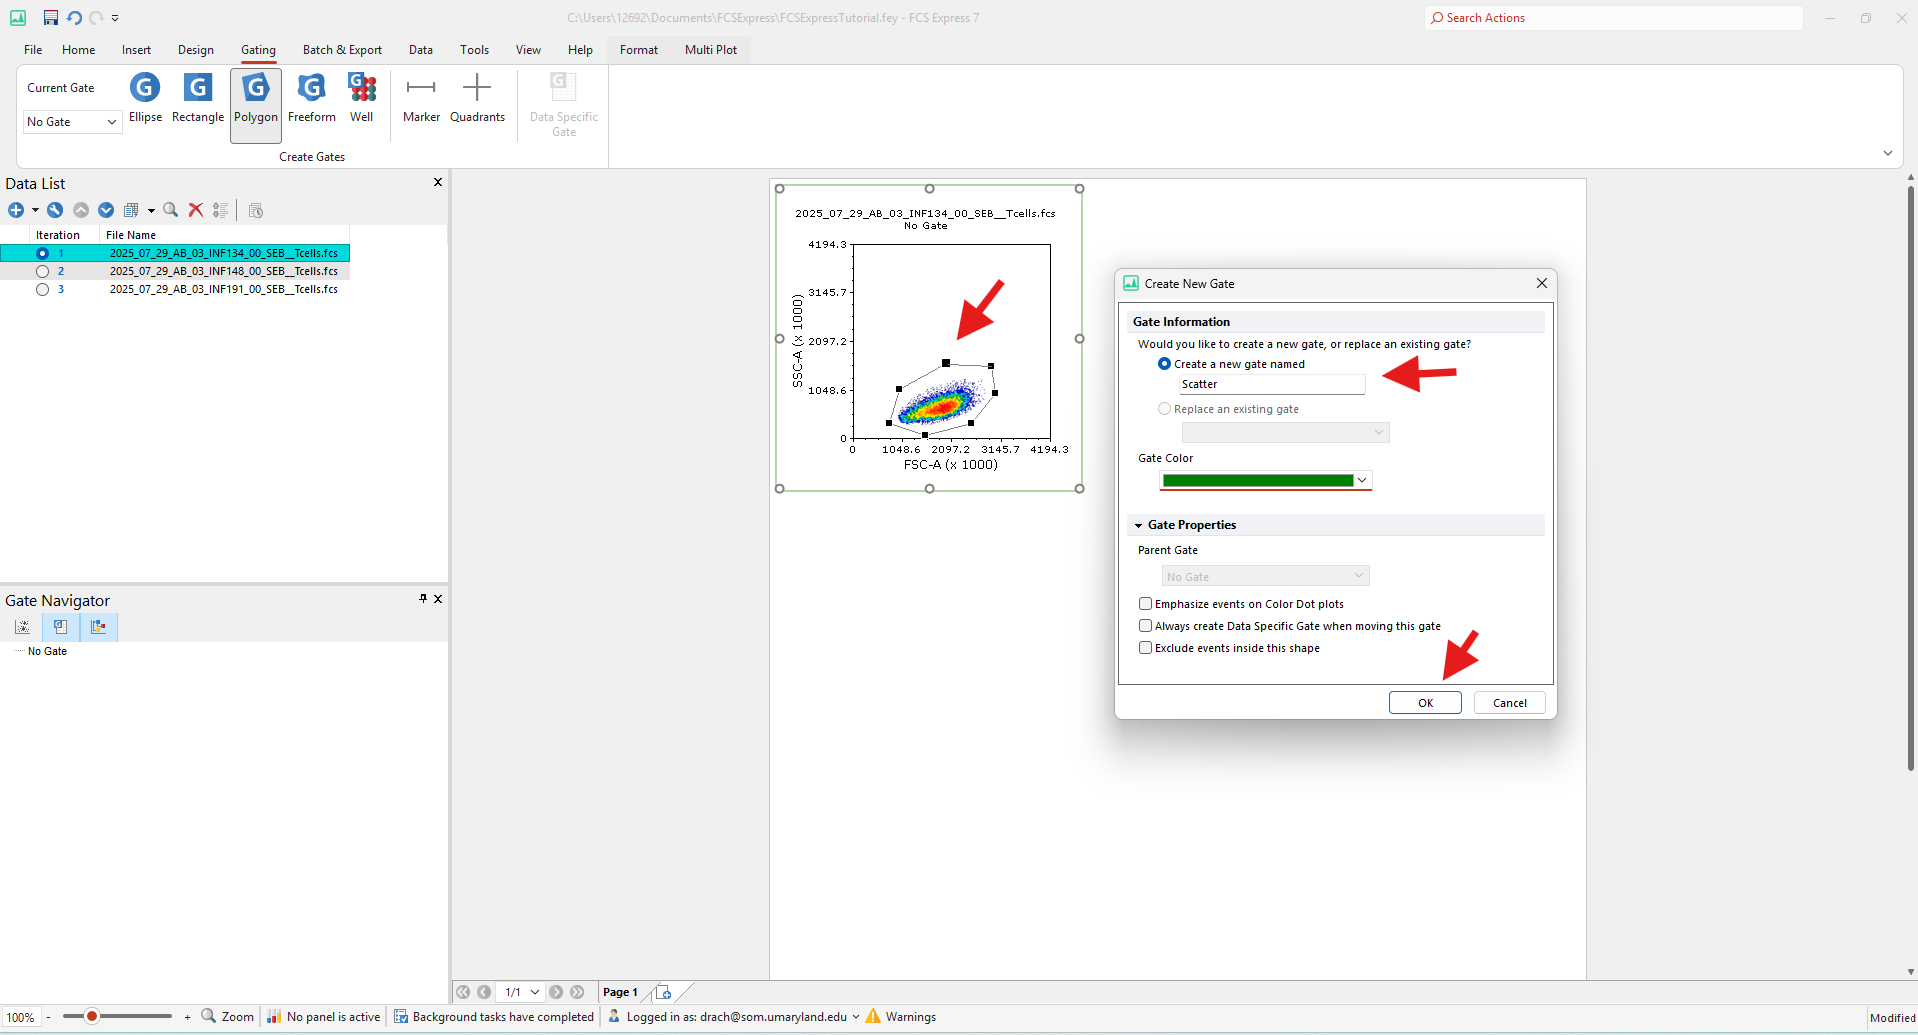
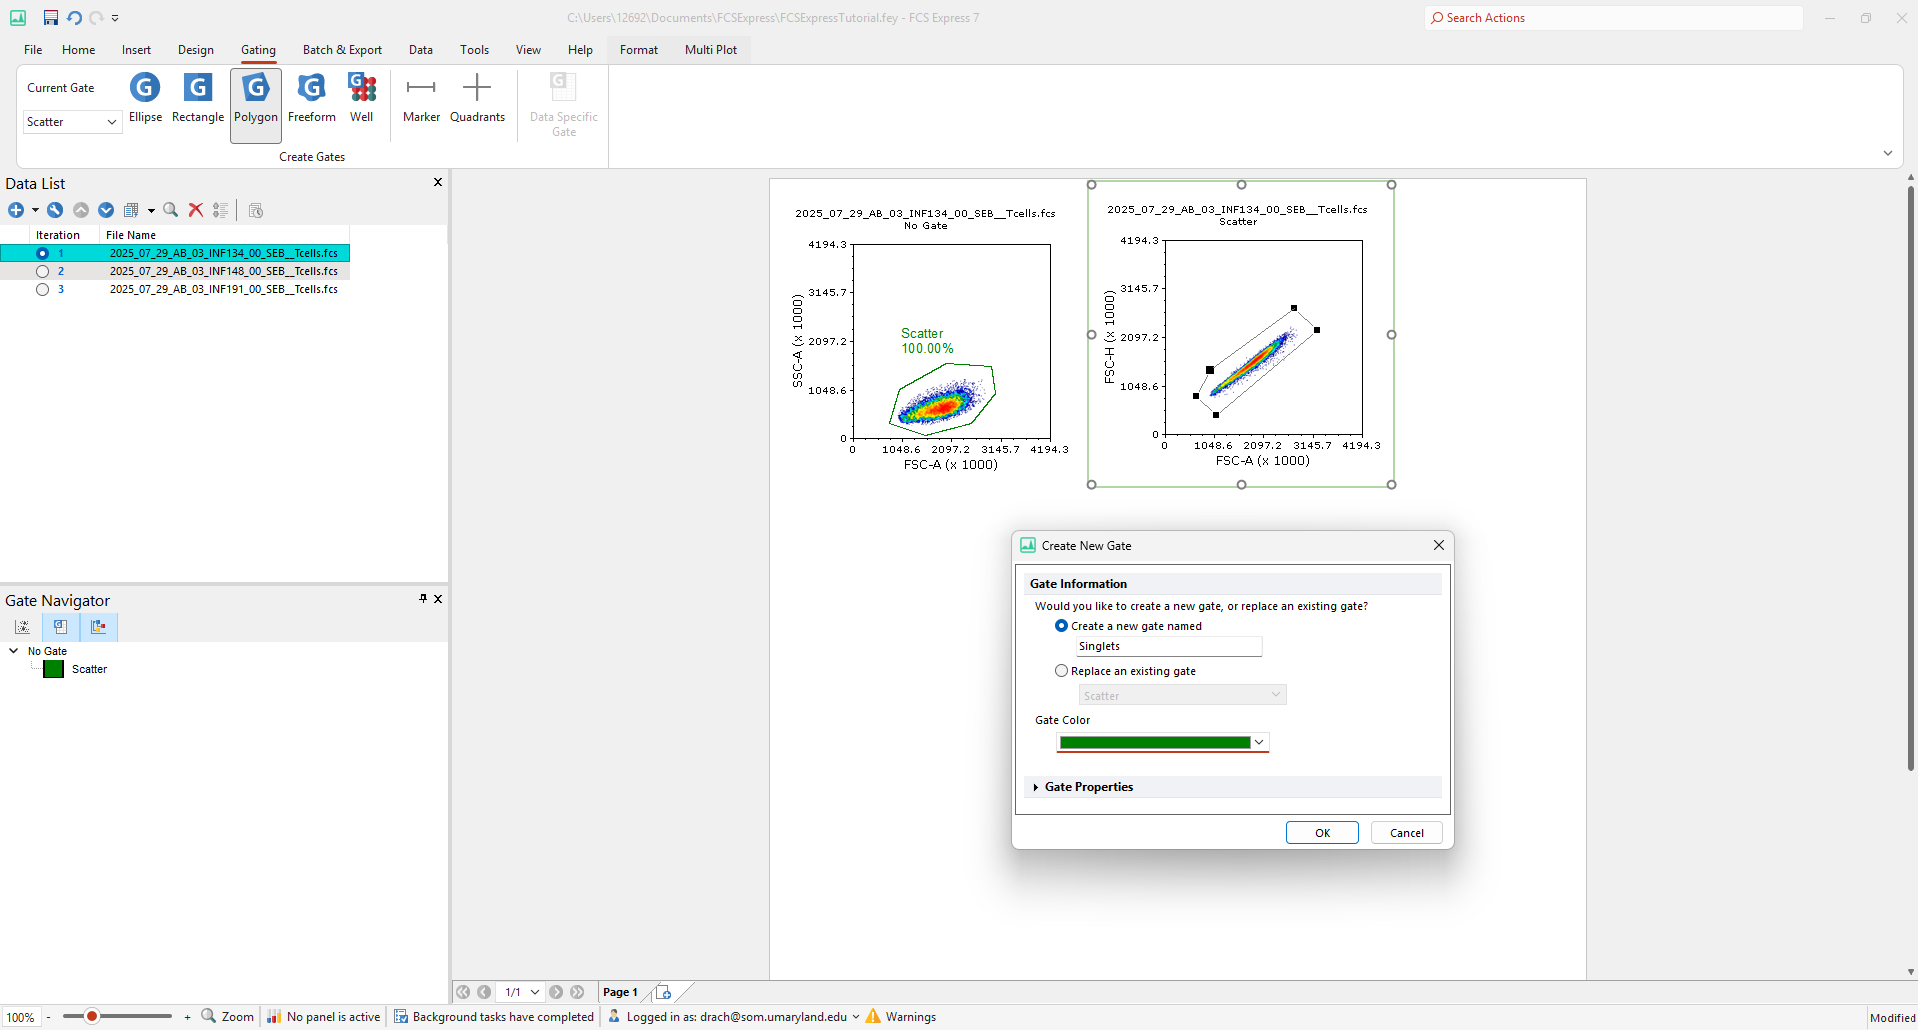
Draw a gate around the population in your first plot. Once you close the polygon, a gate pop-up menu will open. It will ask you to name your newly-created gate; you can name this gate “Scatter”. Below the naming option, there is an option to choose the gate color. Make sure the gate color will be easily visible on the plot, you can change the color by clicking on the color bar.
Once you are happy with your gate name and color, click OK to close the pop-up menu.
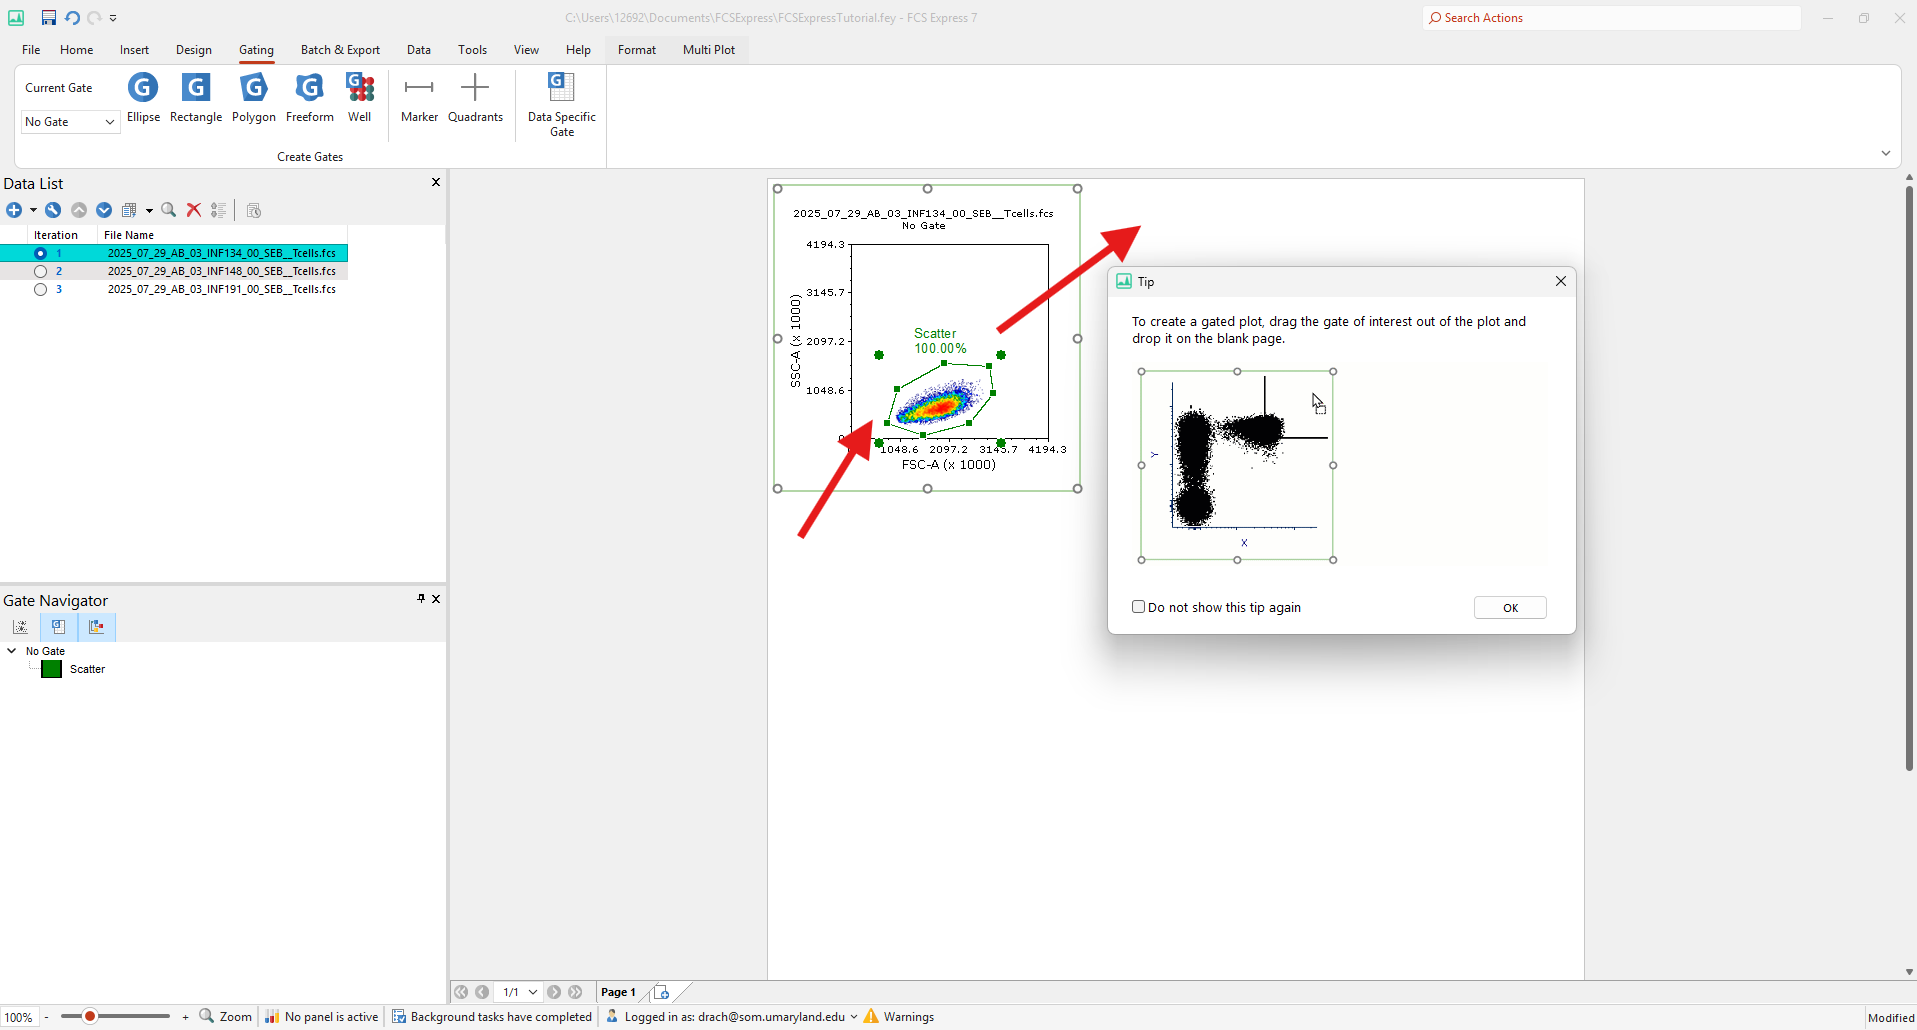
To create a plot of the events within your first gate, click the gate, then drag it to an empty area of the page. This should open up a new density plot.
Your new plot will have the name of the gate which you are within, listed with the file name/plot title. If you look at your first plot, it will say “No Gate”.
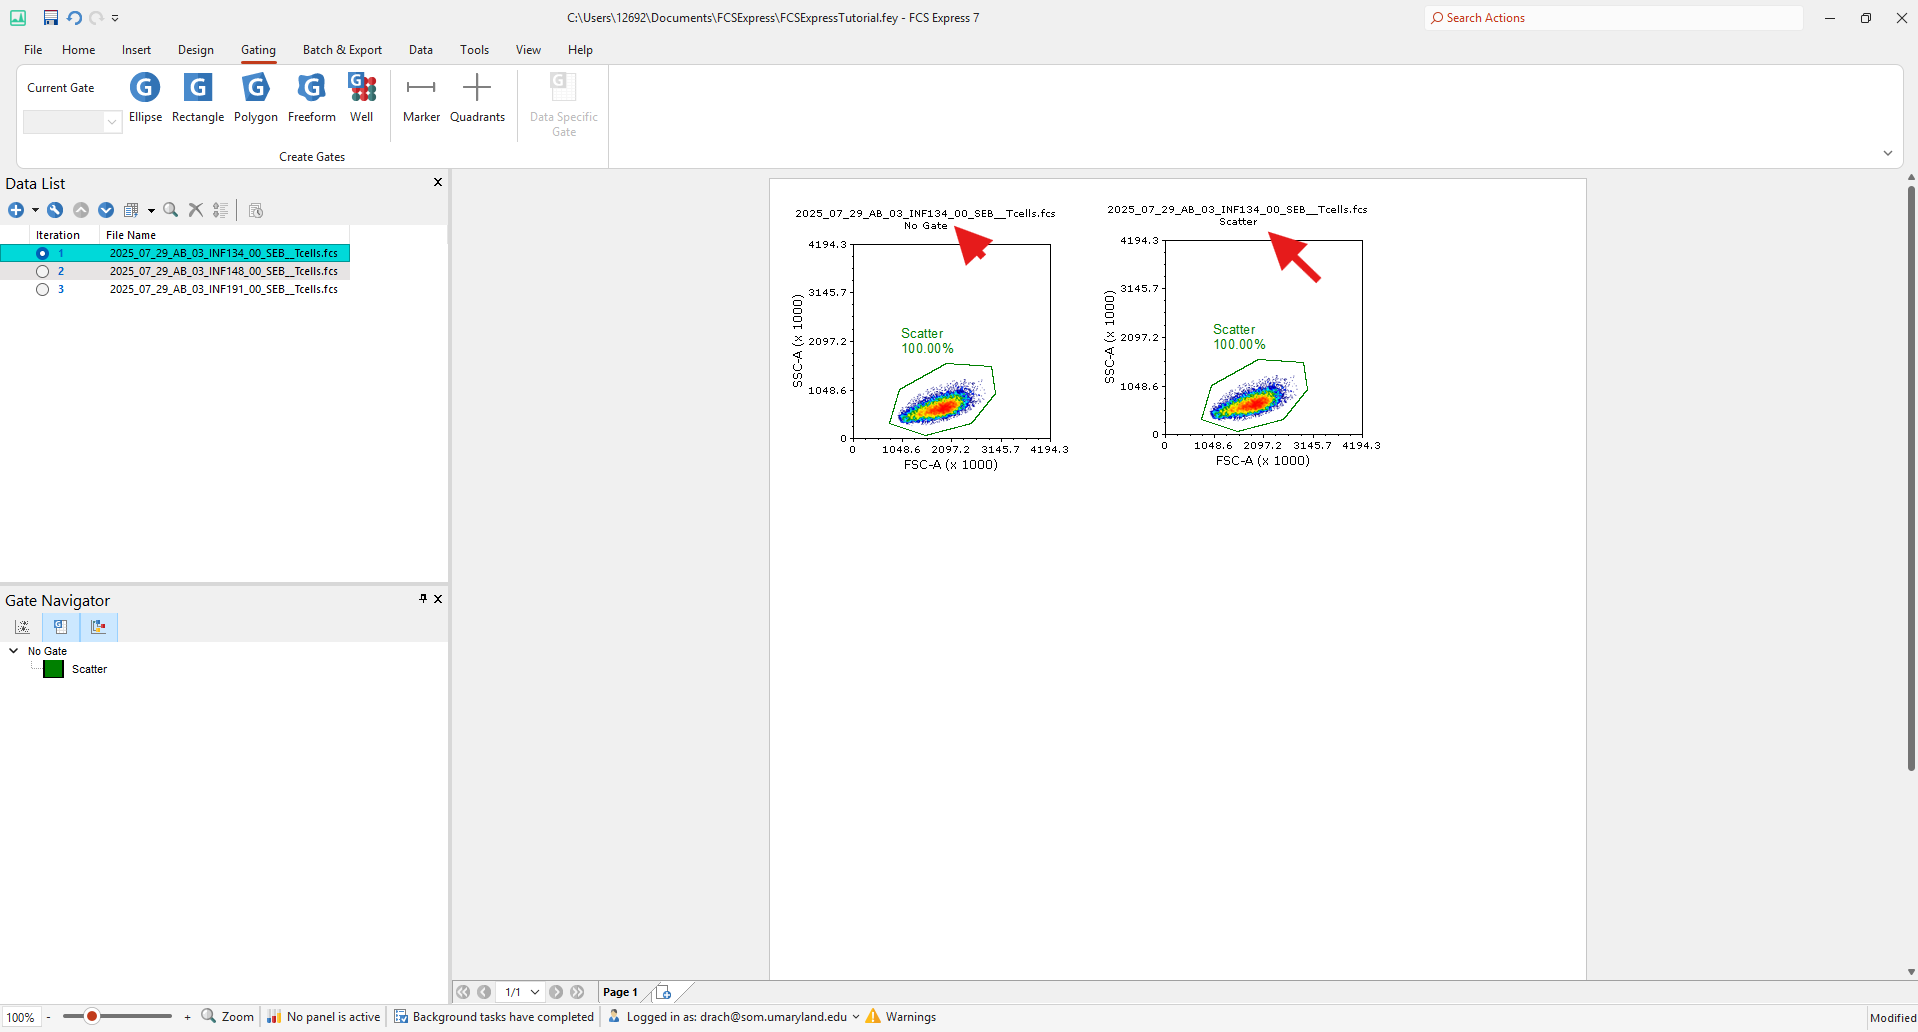
Next, click on the Y axis of the second plot and change it to display FSC-H.
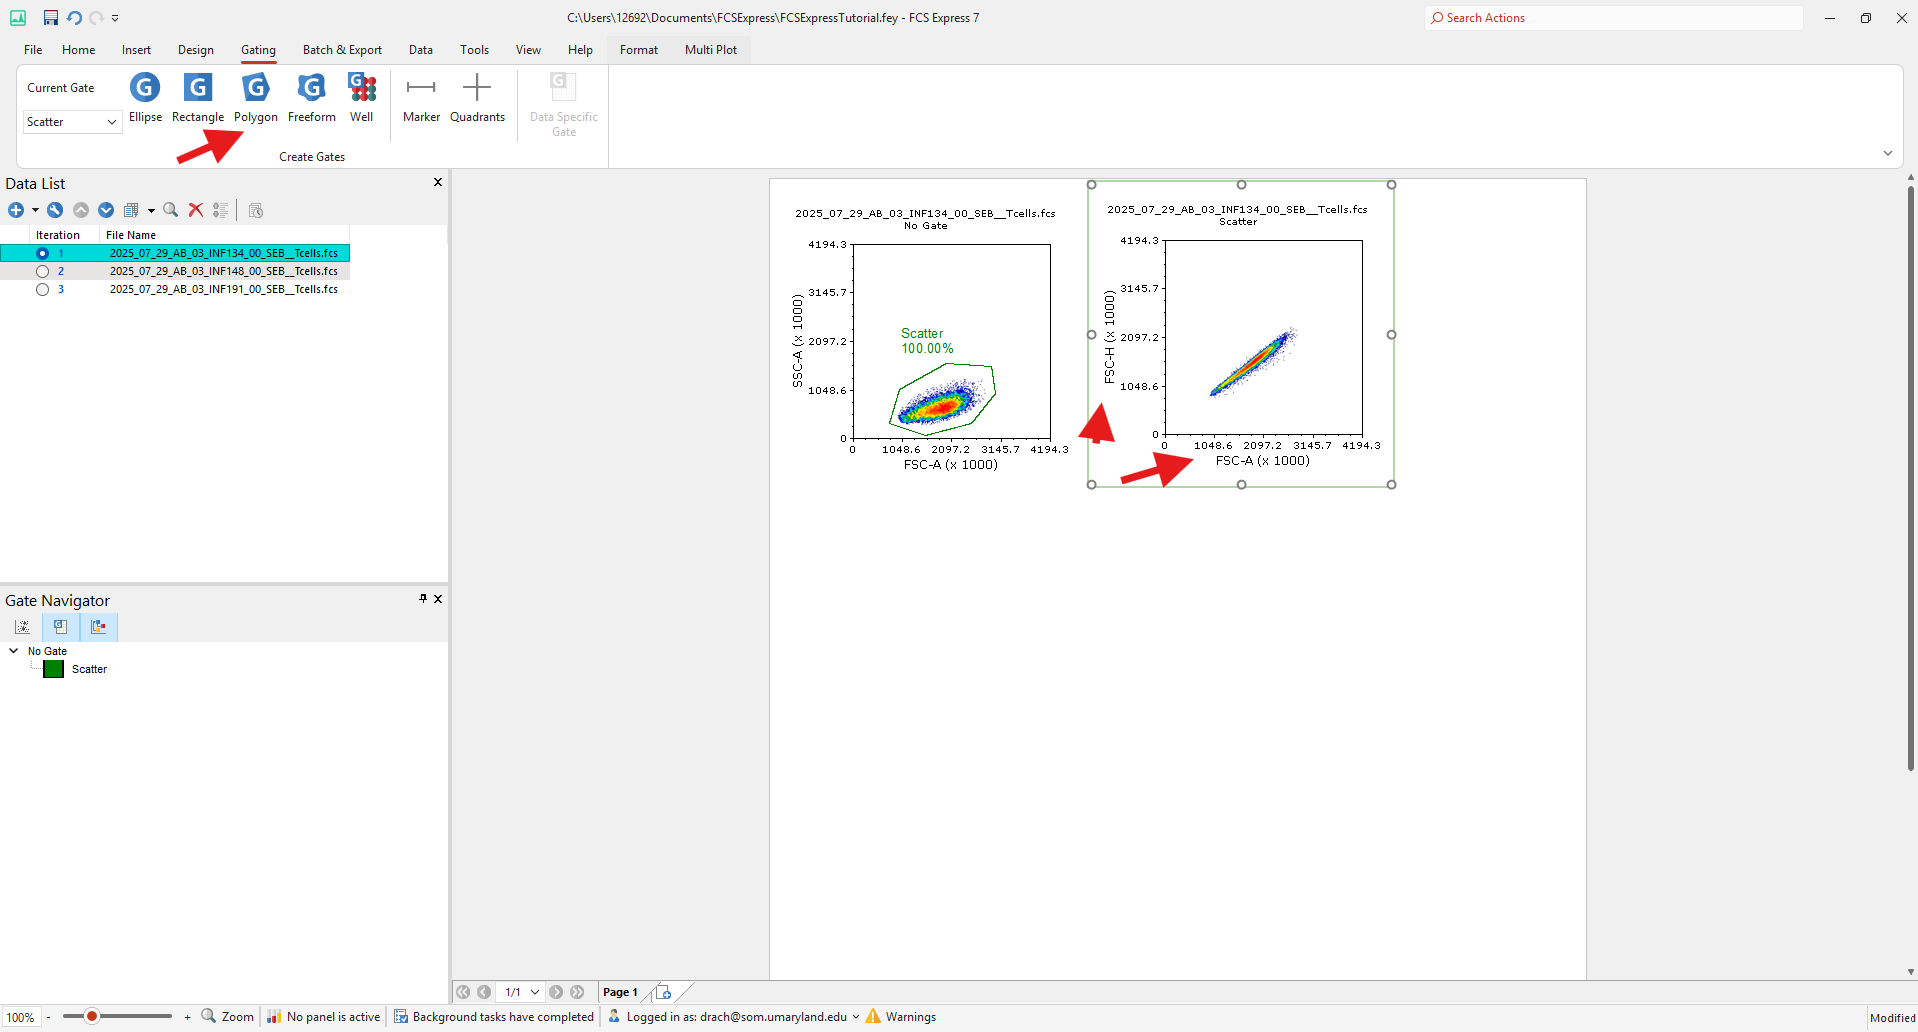
Select the Polygon gate option from within the Gating menu again, draw a gate around your singlet population. Within the gate pop-up menu, label your gate and choose a gate color.
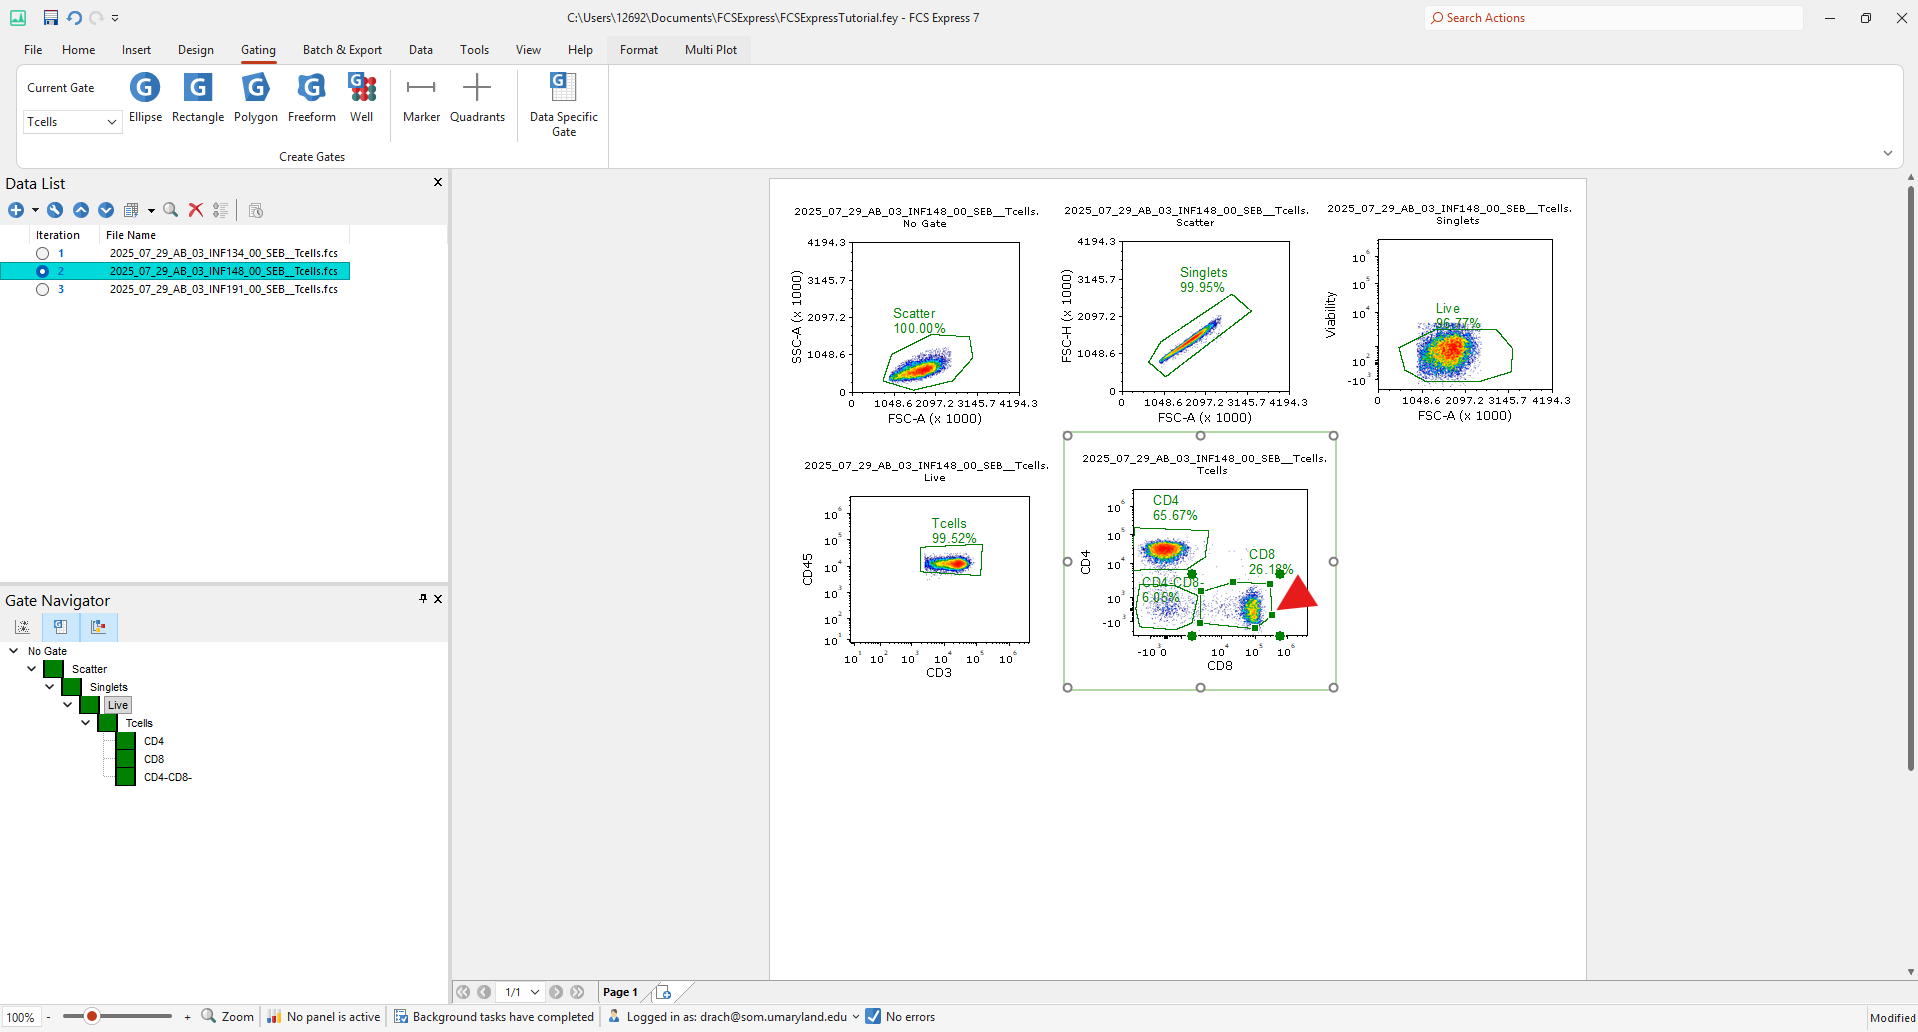
Repeat the process of clicking your gate and dragging to an empty area on the page to create more nested gates. You can see the order of your gates on the side in the Gate Navigator window, below your Data List.
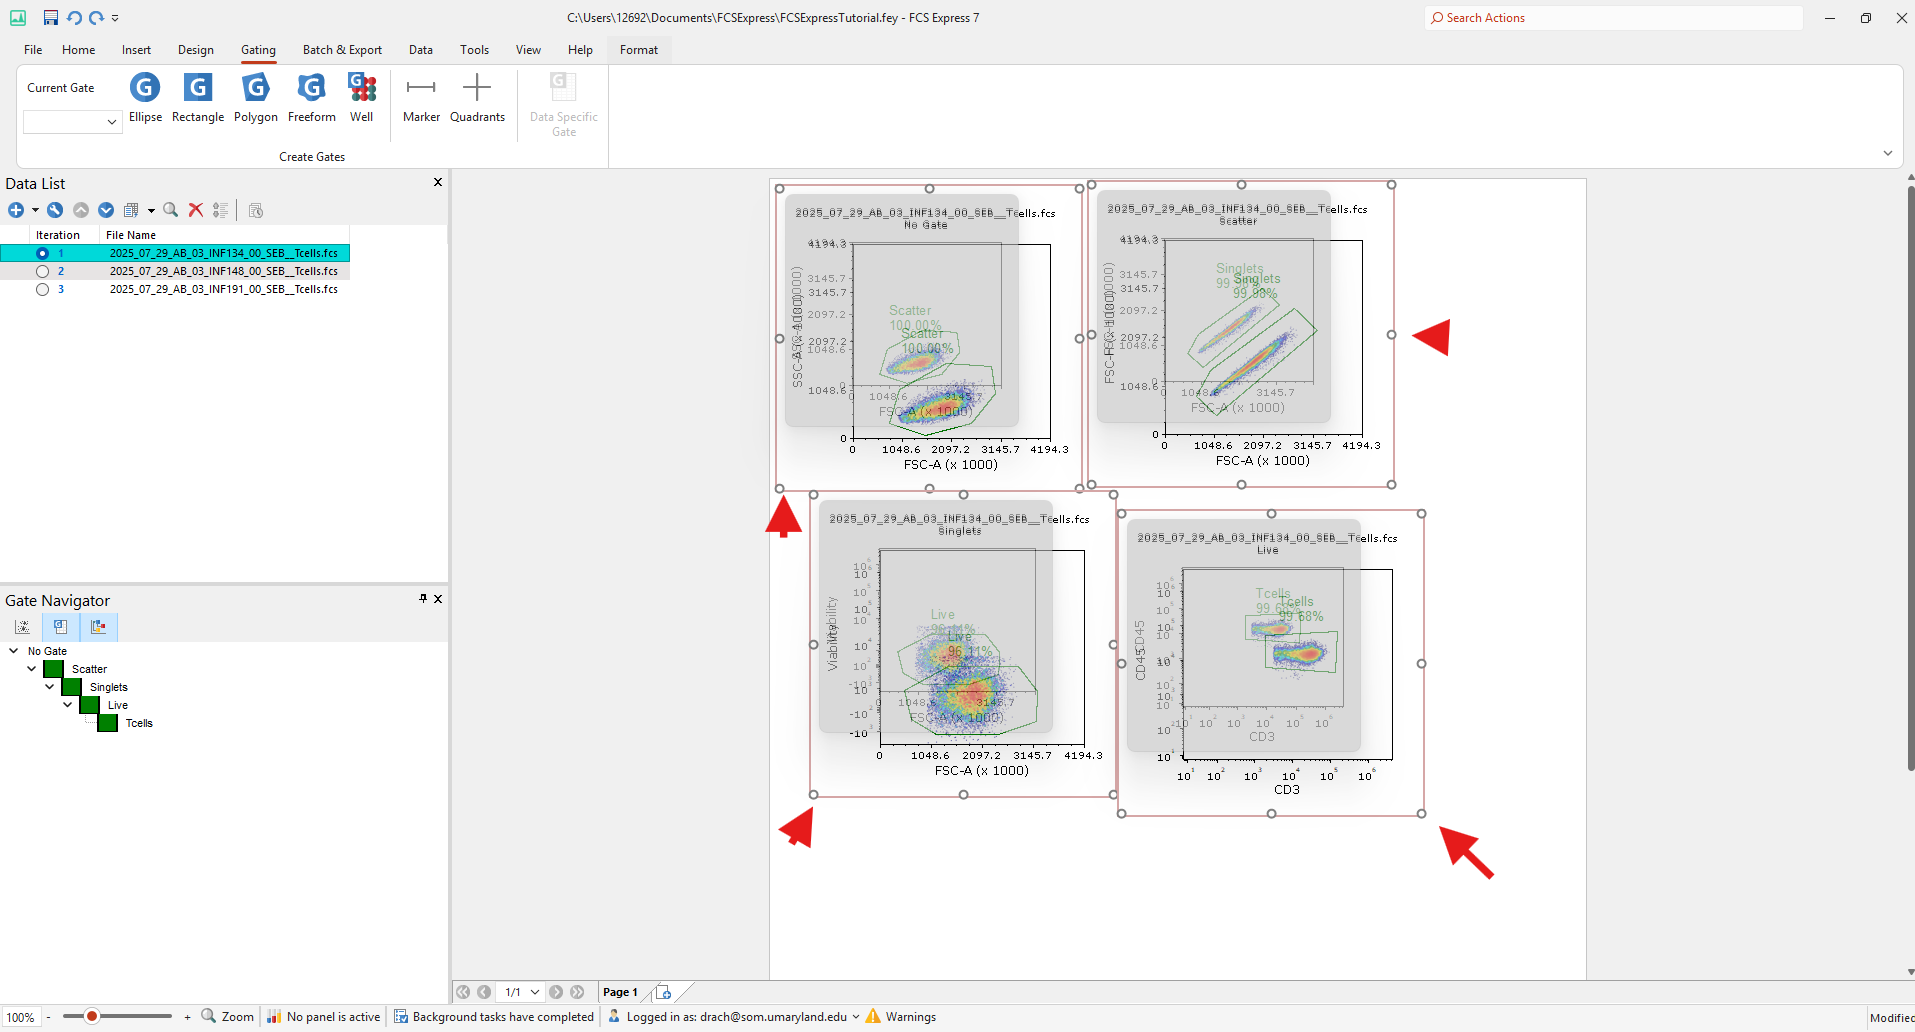
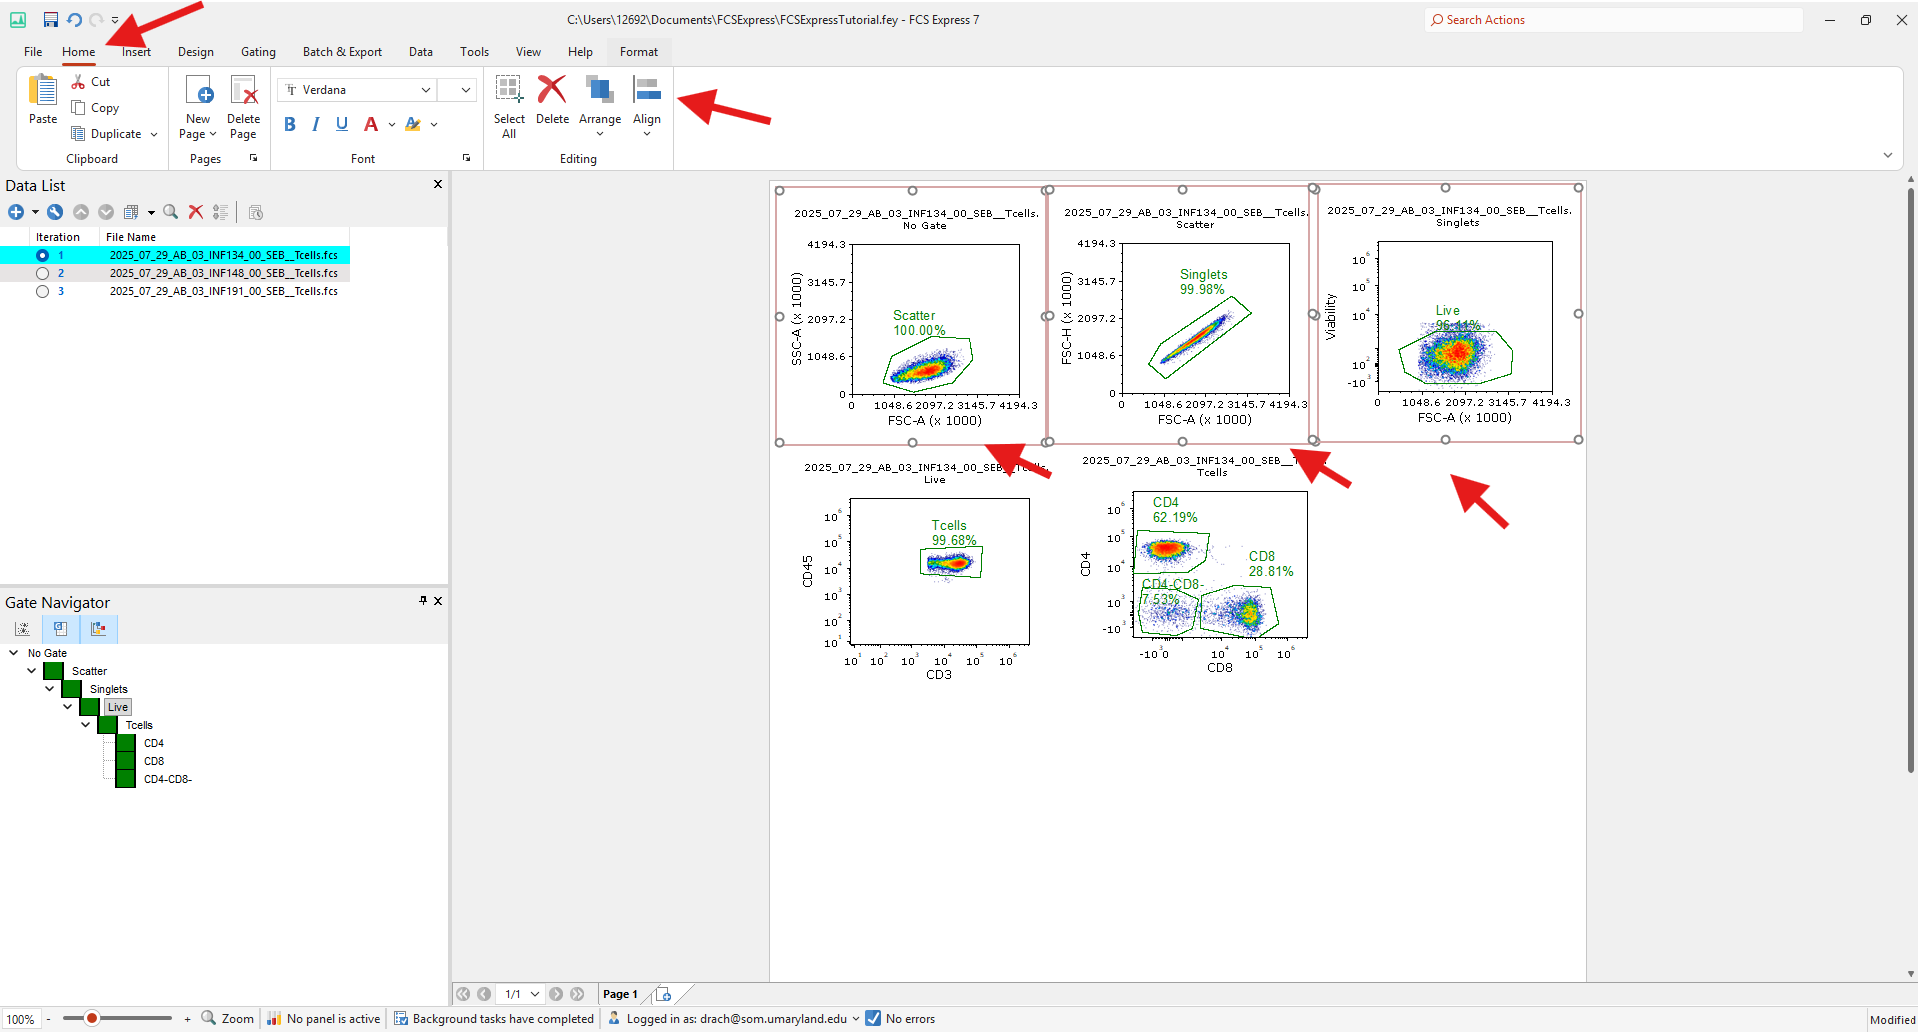
You can click on your plots and drag them to move or resize, until they are laid out in a way that is clear to you.
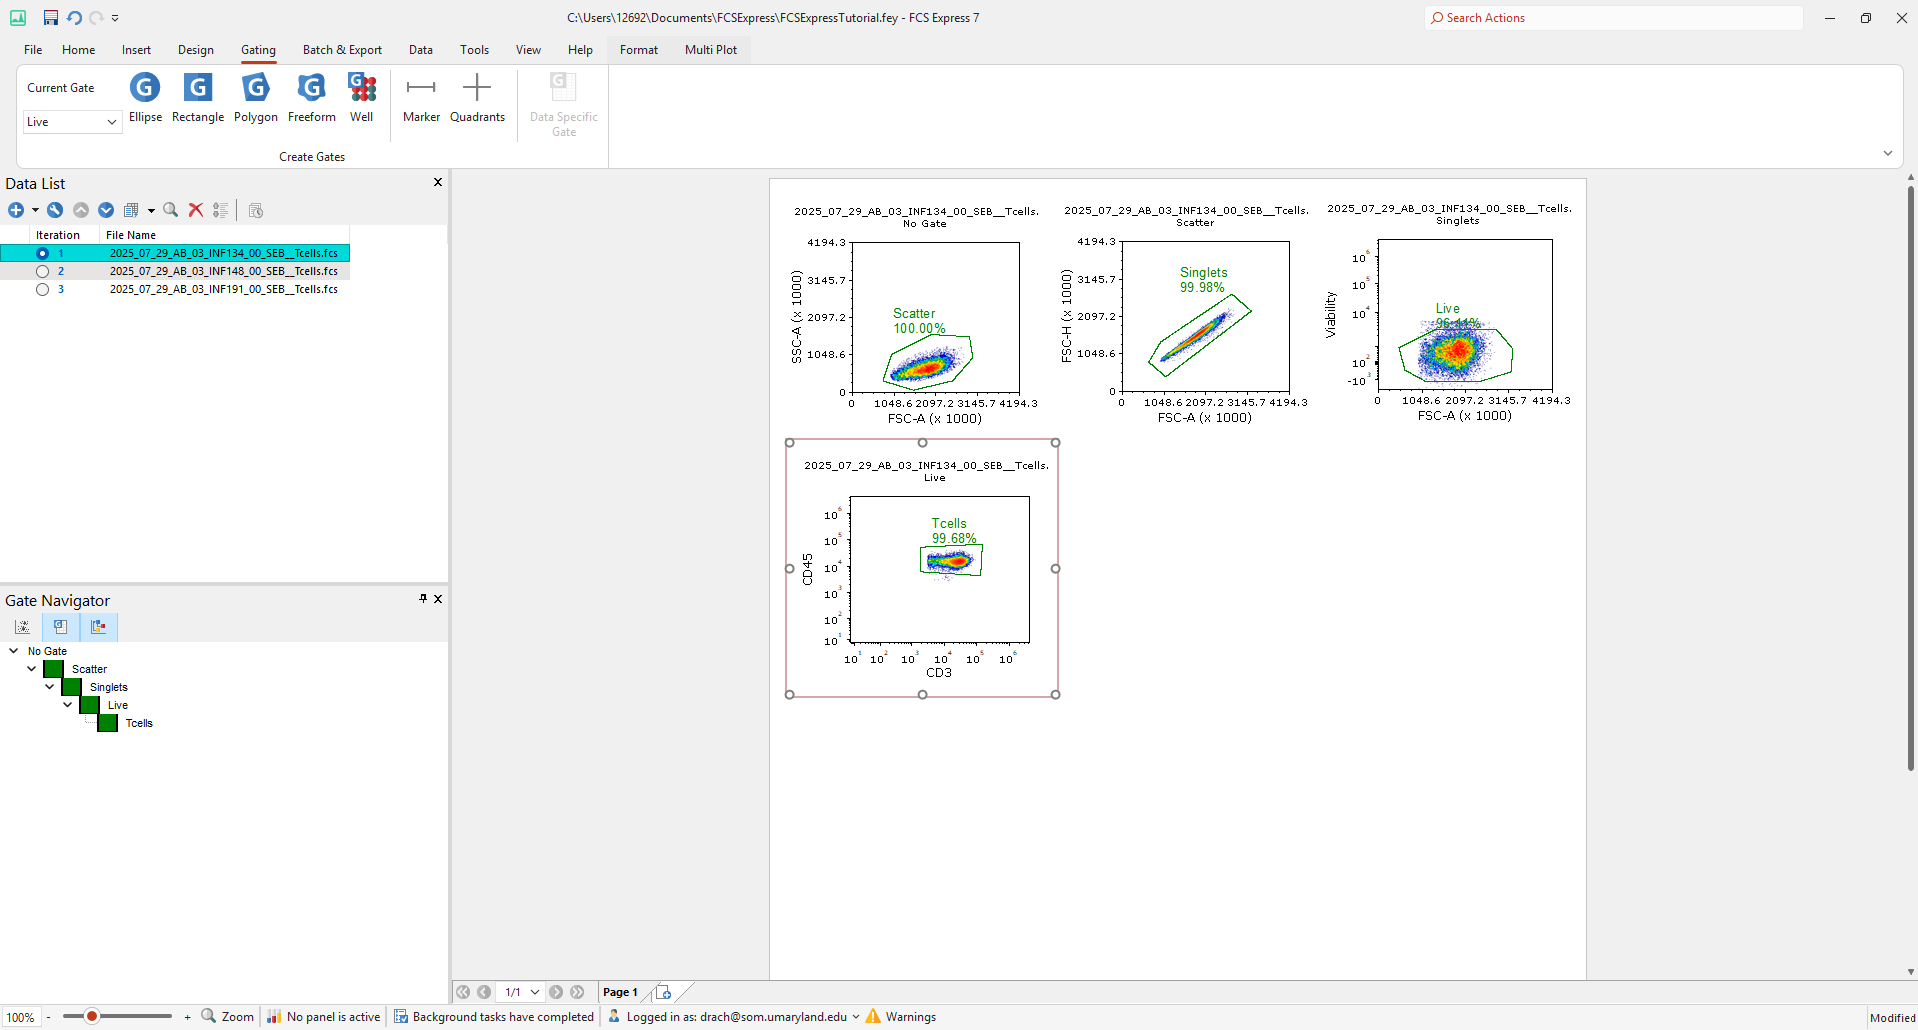
If there are multiple populations of interest within one plot, you can create gates around each population, which are all nested within one parent gate. For example, here the axes of the density plot are CD8 and CD4 marker intensity, and this plot shows events within the gate “Tcells” which was drawn from the graph of CD45 versus CD3.
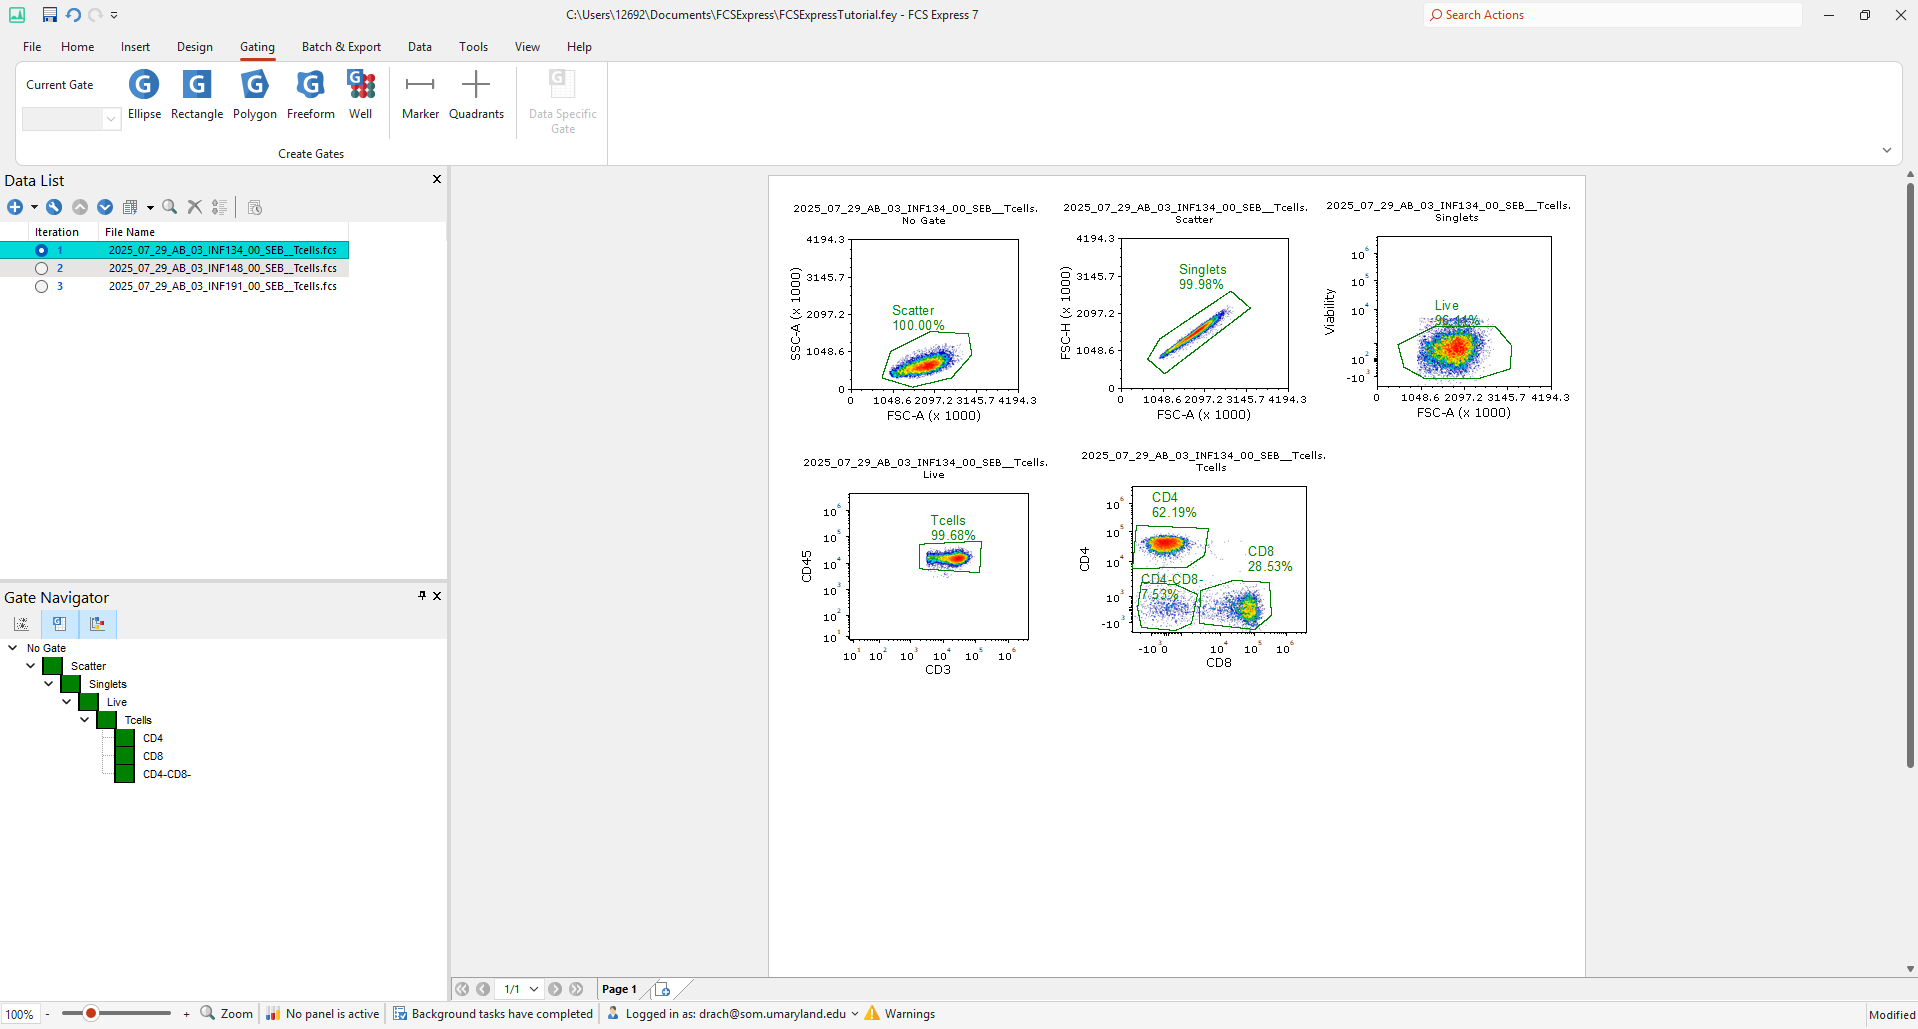
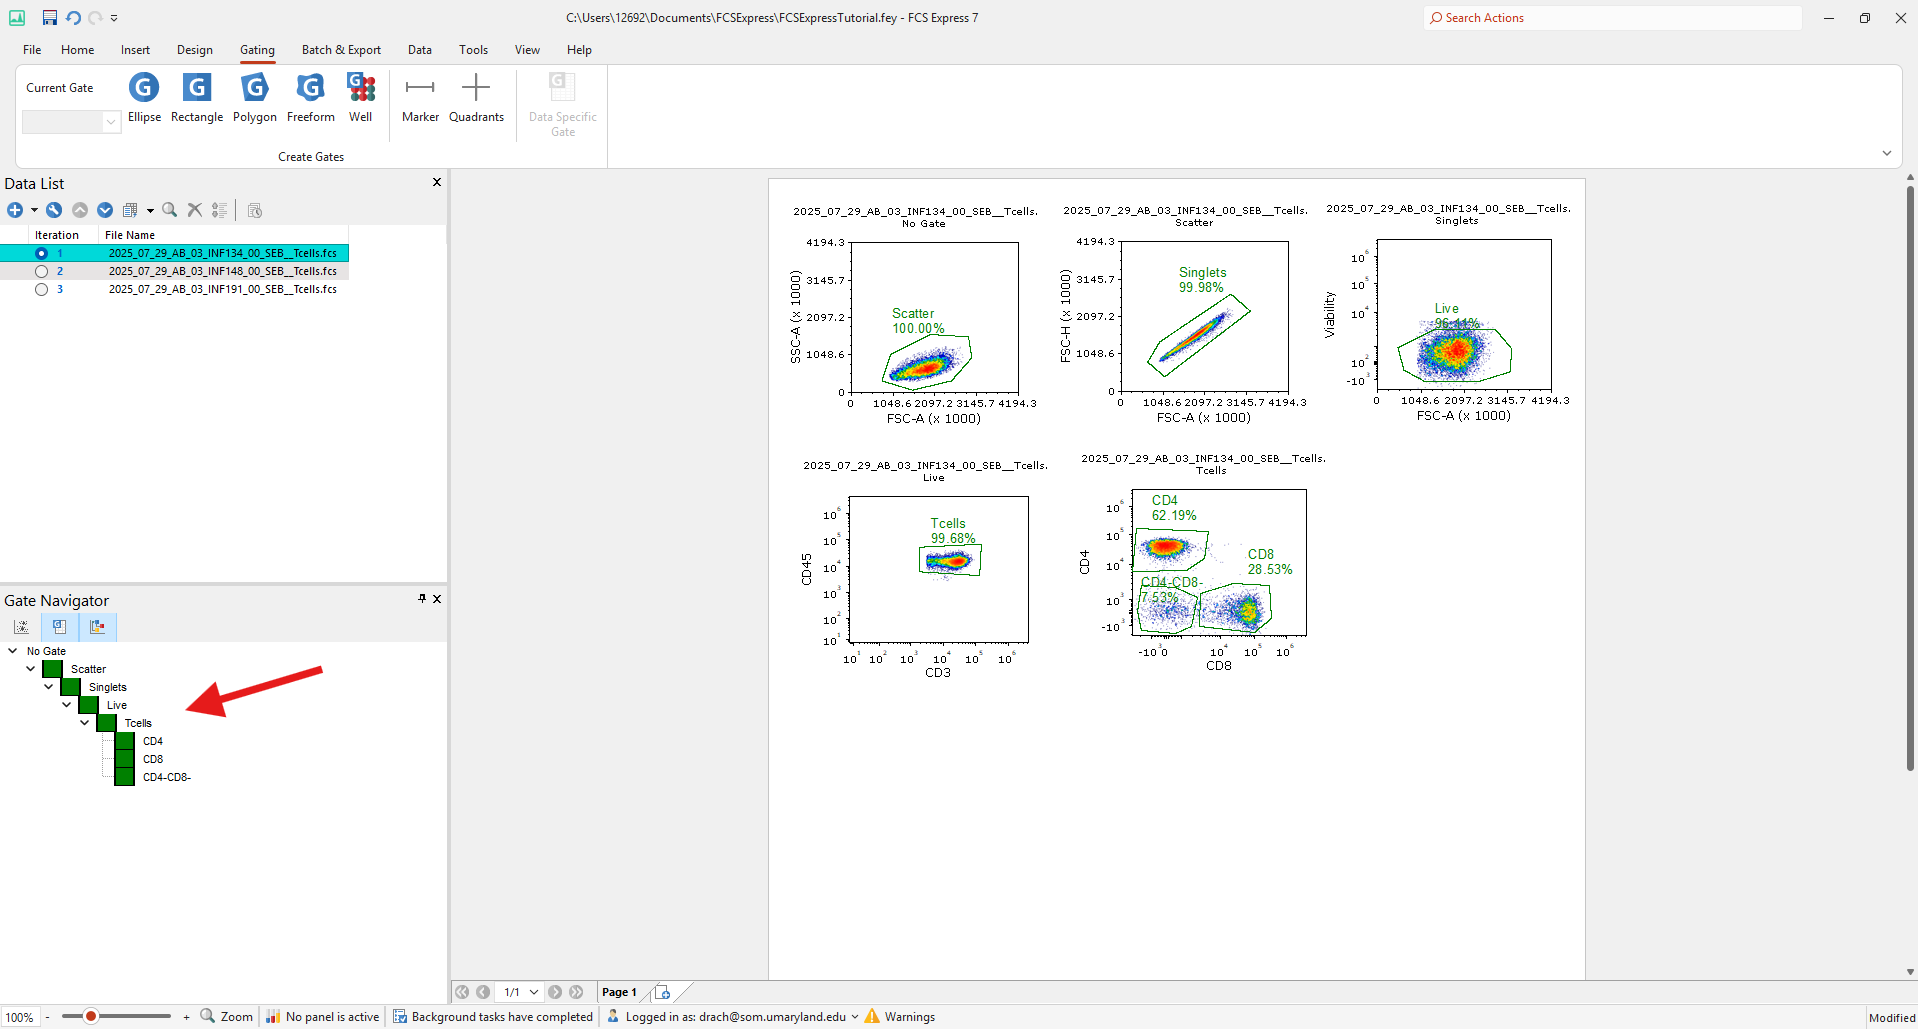
Gates at the same level in the gating hierarchy will display as aligned vertically in the Gate Navigator.
Analyzing Data
Now that you have created your basic plots and gates, you may wish to look at these markers and gate on populations of interest for another data file. To analyze data from another file, simply click on that file in your Data list.
You may see a pop up which warns that you do not have Raw (not unmixed) files for that data, you can simply ignore this pop up and continue to click in to the other data file.
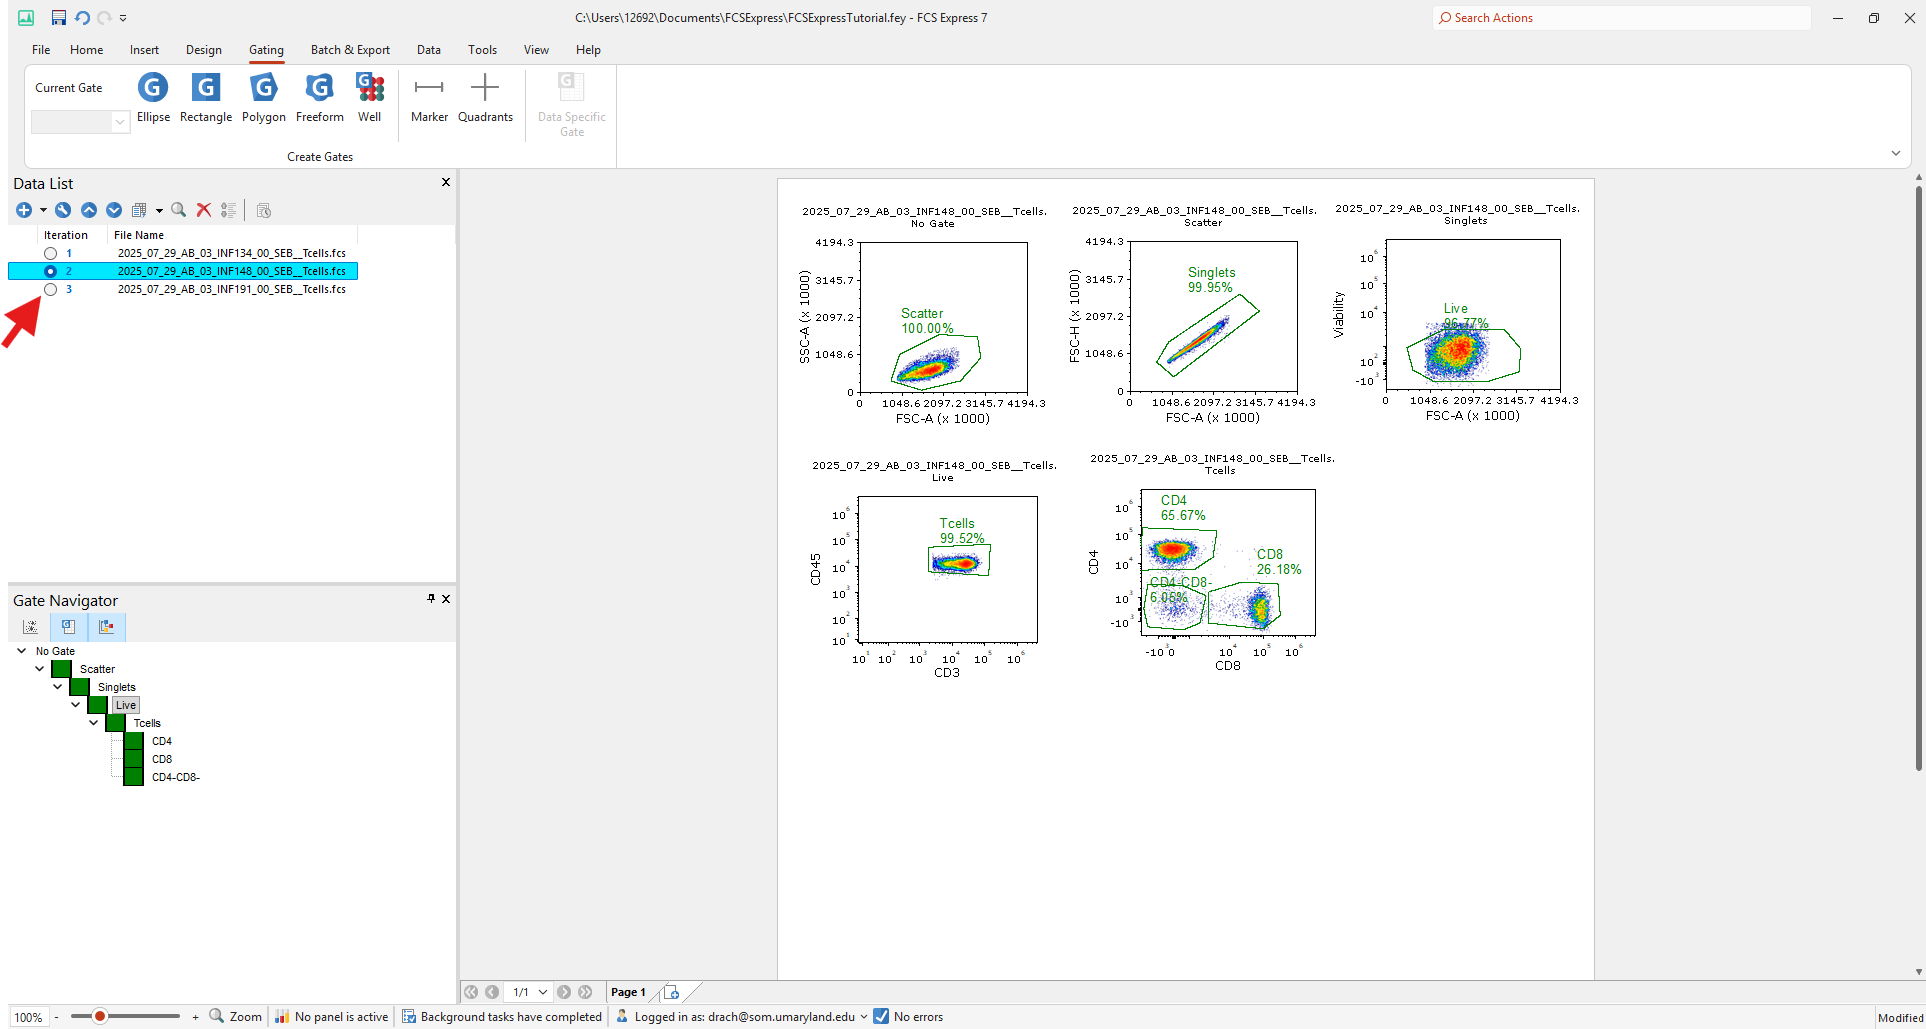
You may wish to adjust the gates for your other data file. If you want these changes to your gate to only apply for this data, you must make the gate a Data Specific Gate. To do this, navigate to the Gating menu in the top ribbon, click on the gate, and click on the Data Specific Gate button in the gating menu.
To check if you successfully designated your gate to this data file, check to make sure your gate is listed as data specific in the gate navigator.
Organization & Graphics
To align your plots, select them and return to the Home top ribbon menu, and select the align button. You can align your plots horizontally, vertically, etc.